Chat with Excel
With Flowtrail AI’s “Chat with Excel” feature, you can easily interact with your Excel files, transforming raw data into actionable insights and visualizations. By simply uploading your Excel files, you can ask questions about your data, and Flowtrail AI will analyze the content to provide accurate answers. This feature allows you to explore your data, discover trends, and visualize the results using customized charts and graphs within the Flowtrail AI platform. The “Chat with Excel” feature simplifies the process of making data-driven decisions, whether you are working with complex datasets or just need a quick analysis.
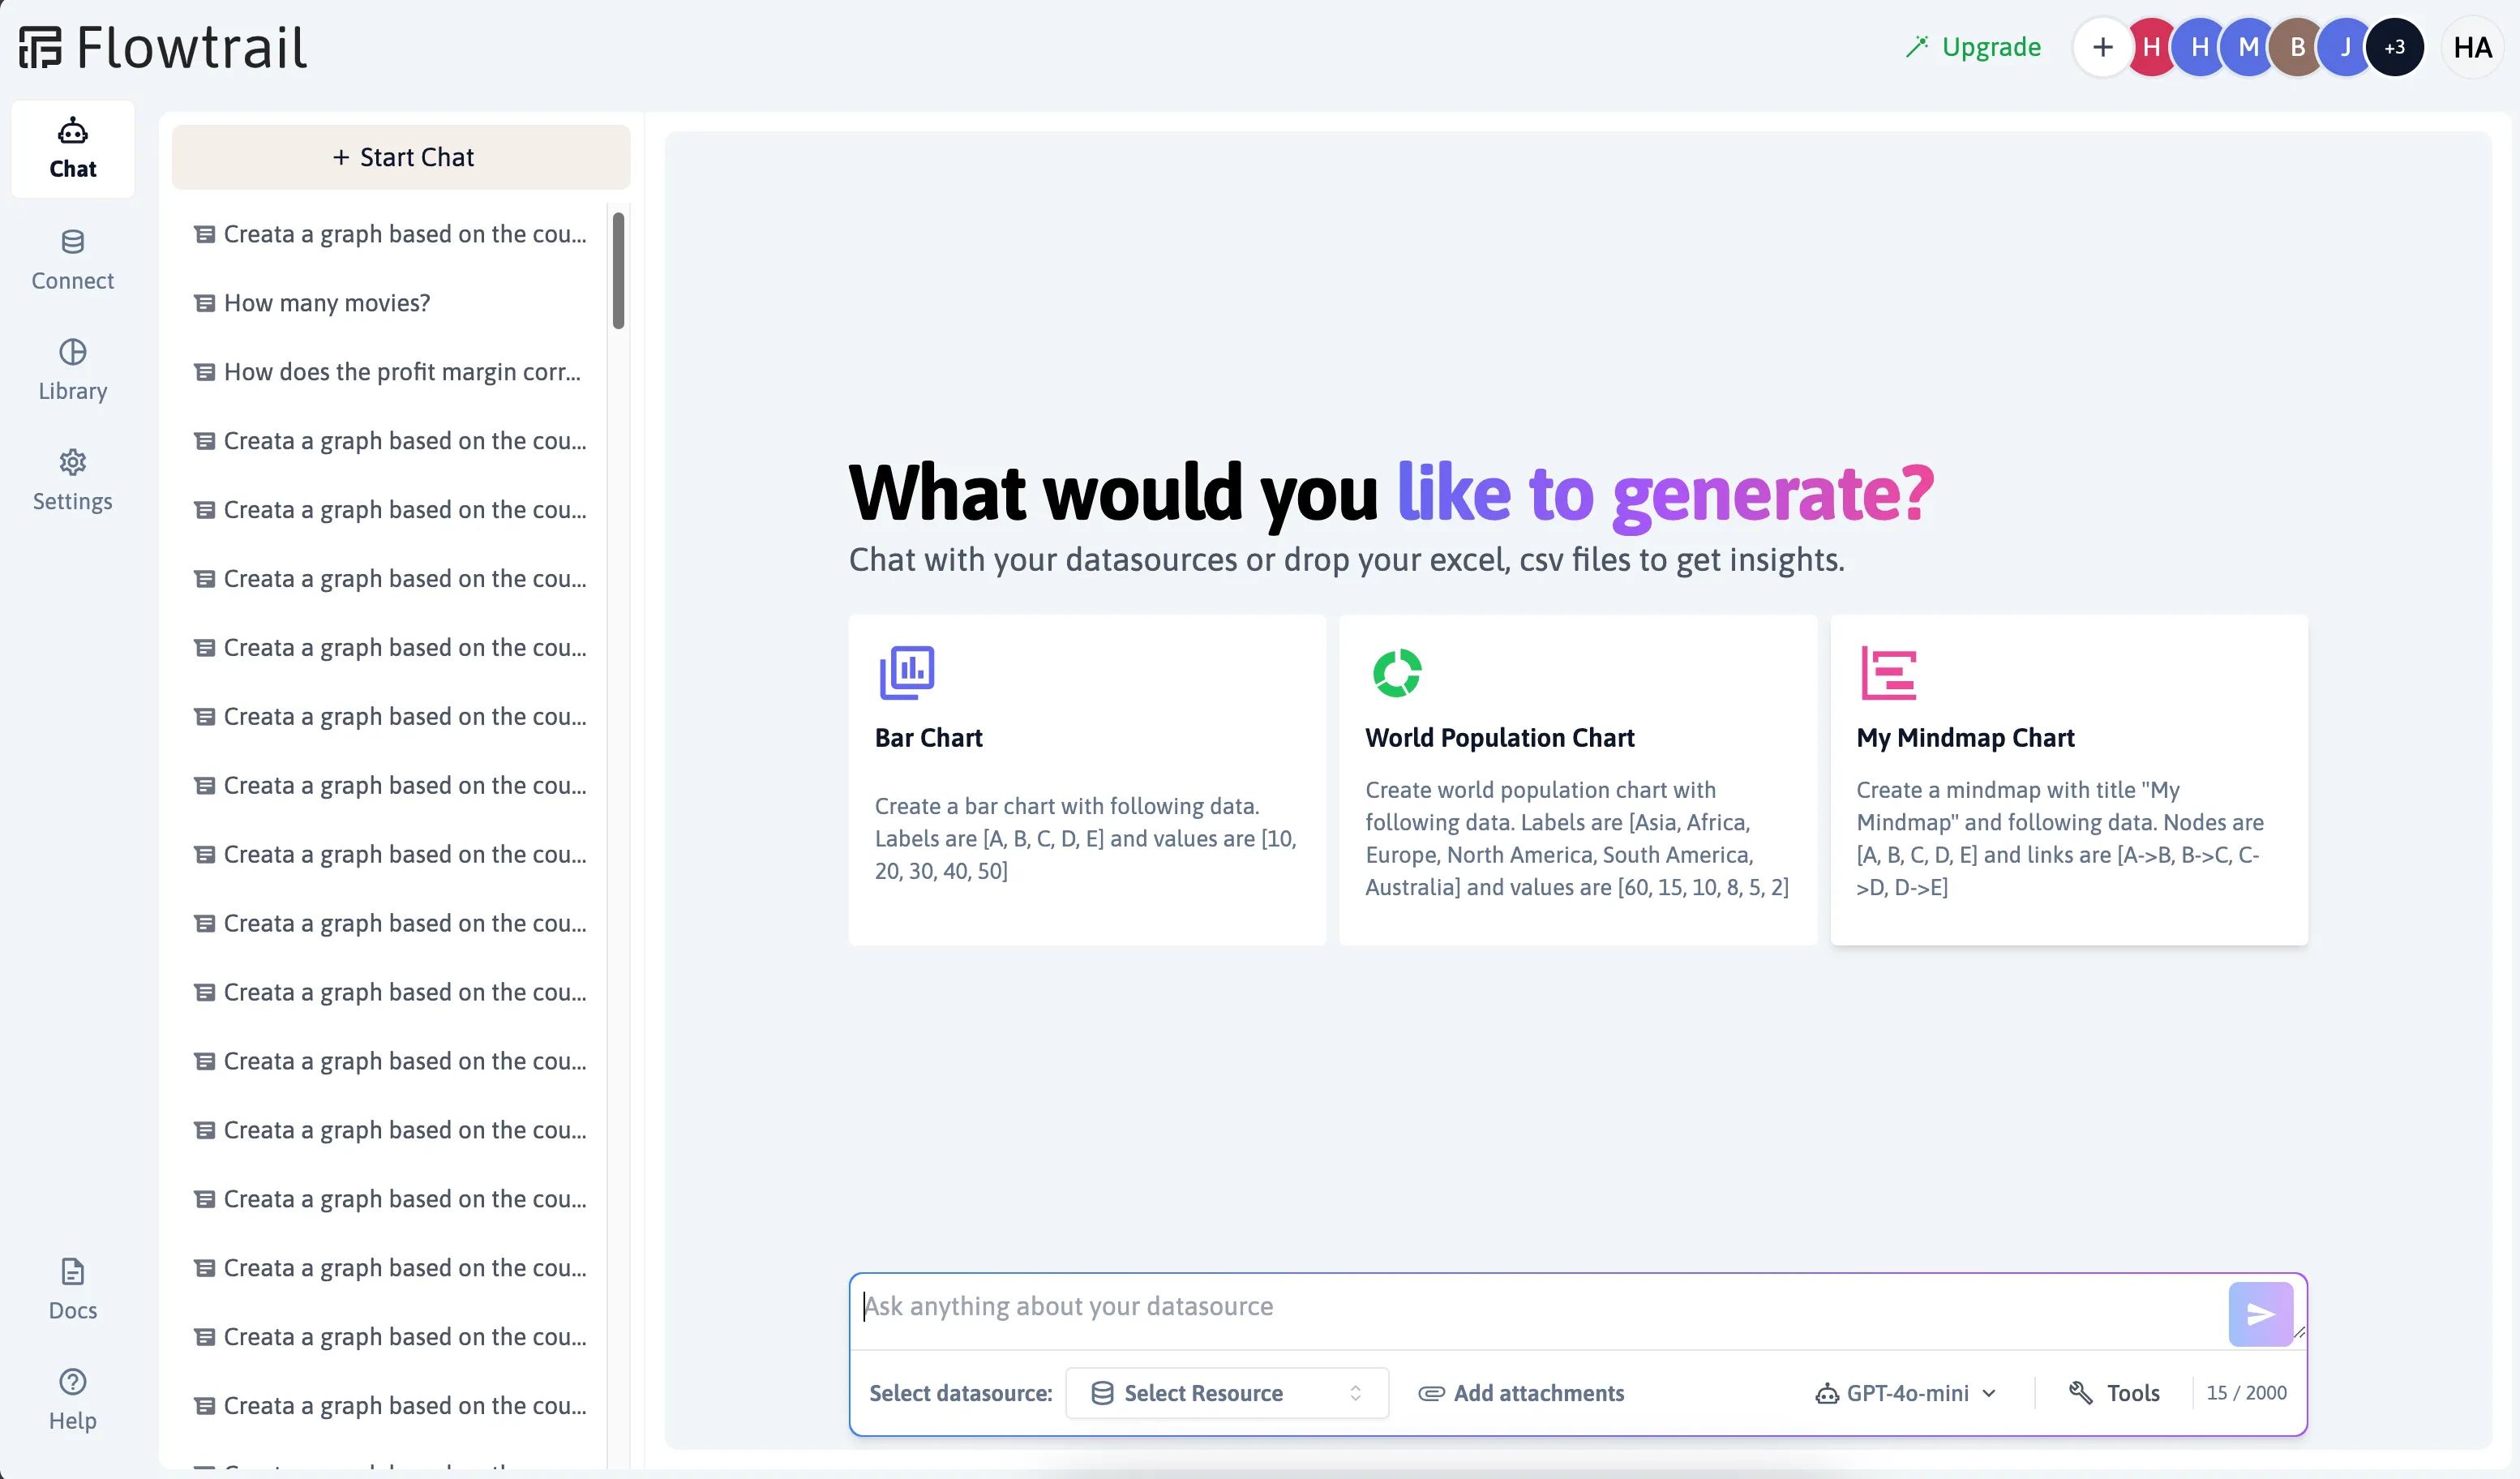
Using Excel Chat
To start using the AI chat feature, go to the AI Chat screen in Flowtrail AI and select the Excel/CSV option. Flowtrail AI currently supports three types of AI chat data sources: Excel/CSV, SQL databases, and diagram generators.
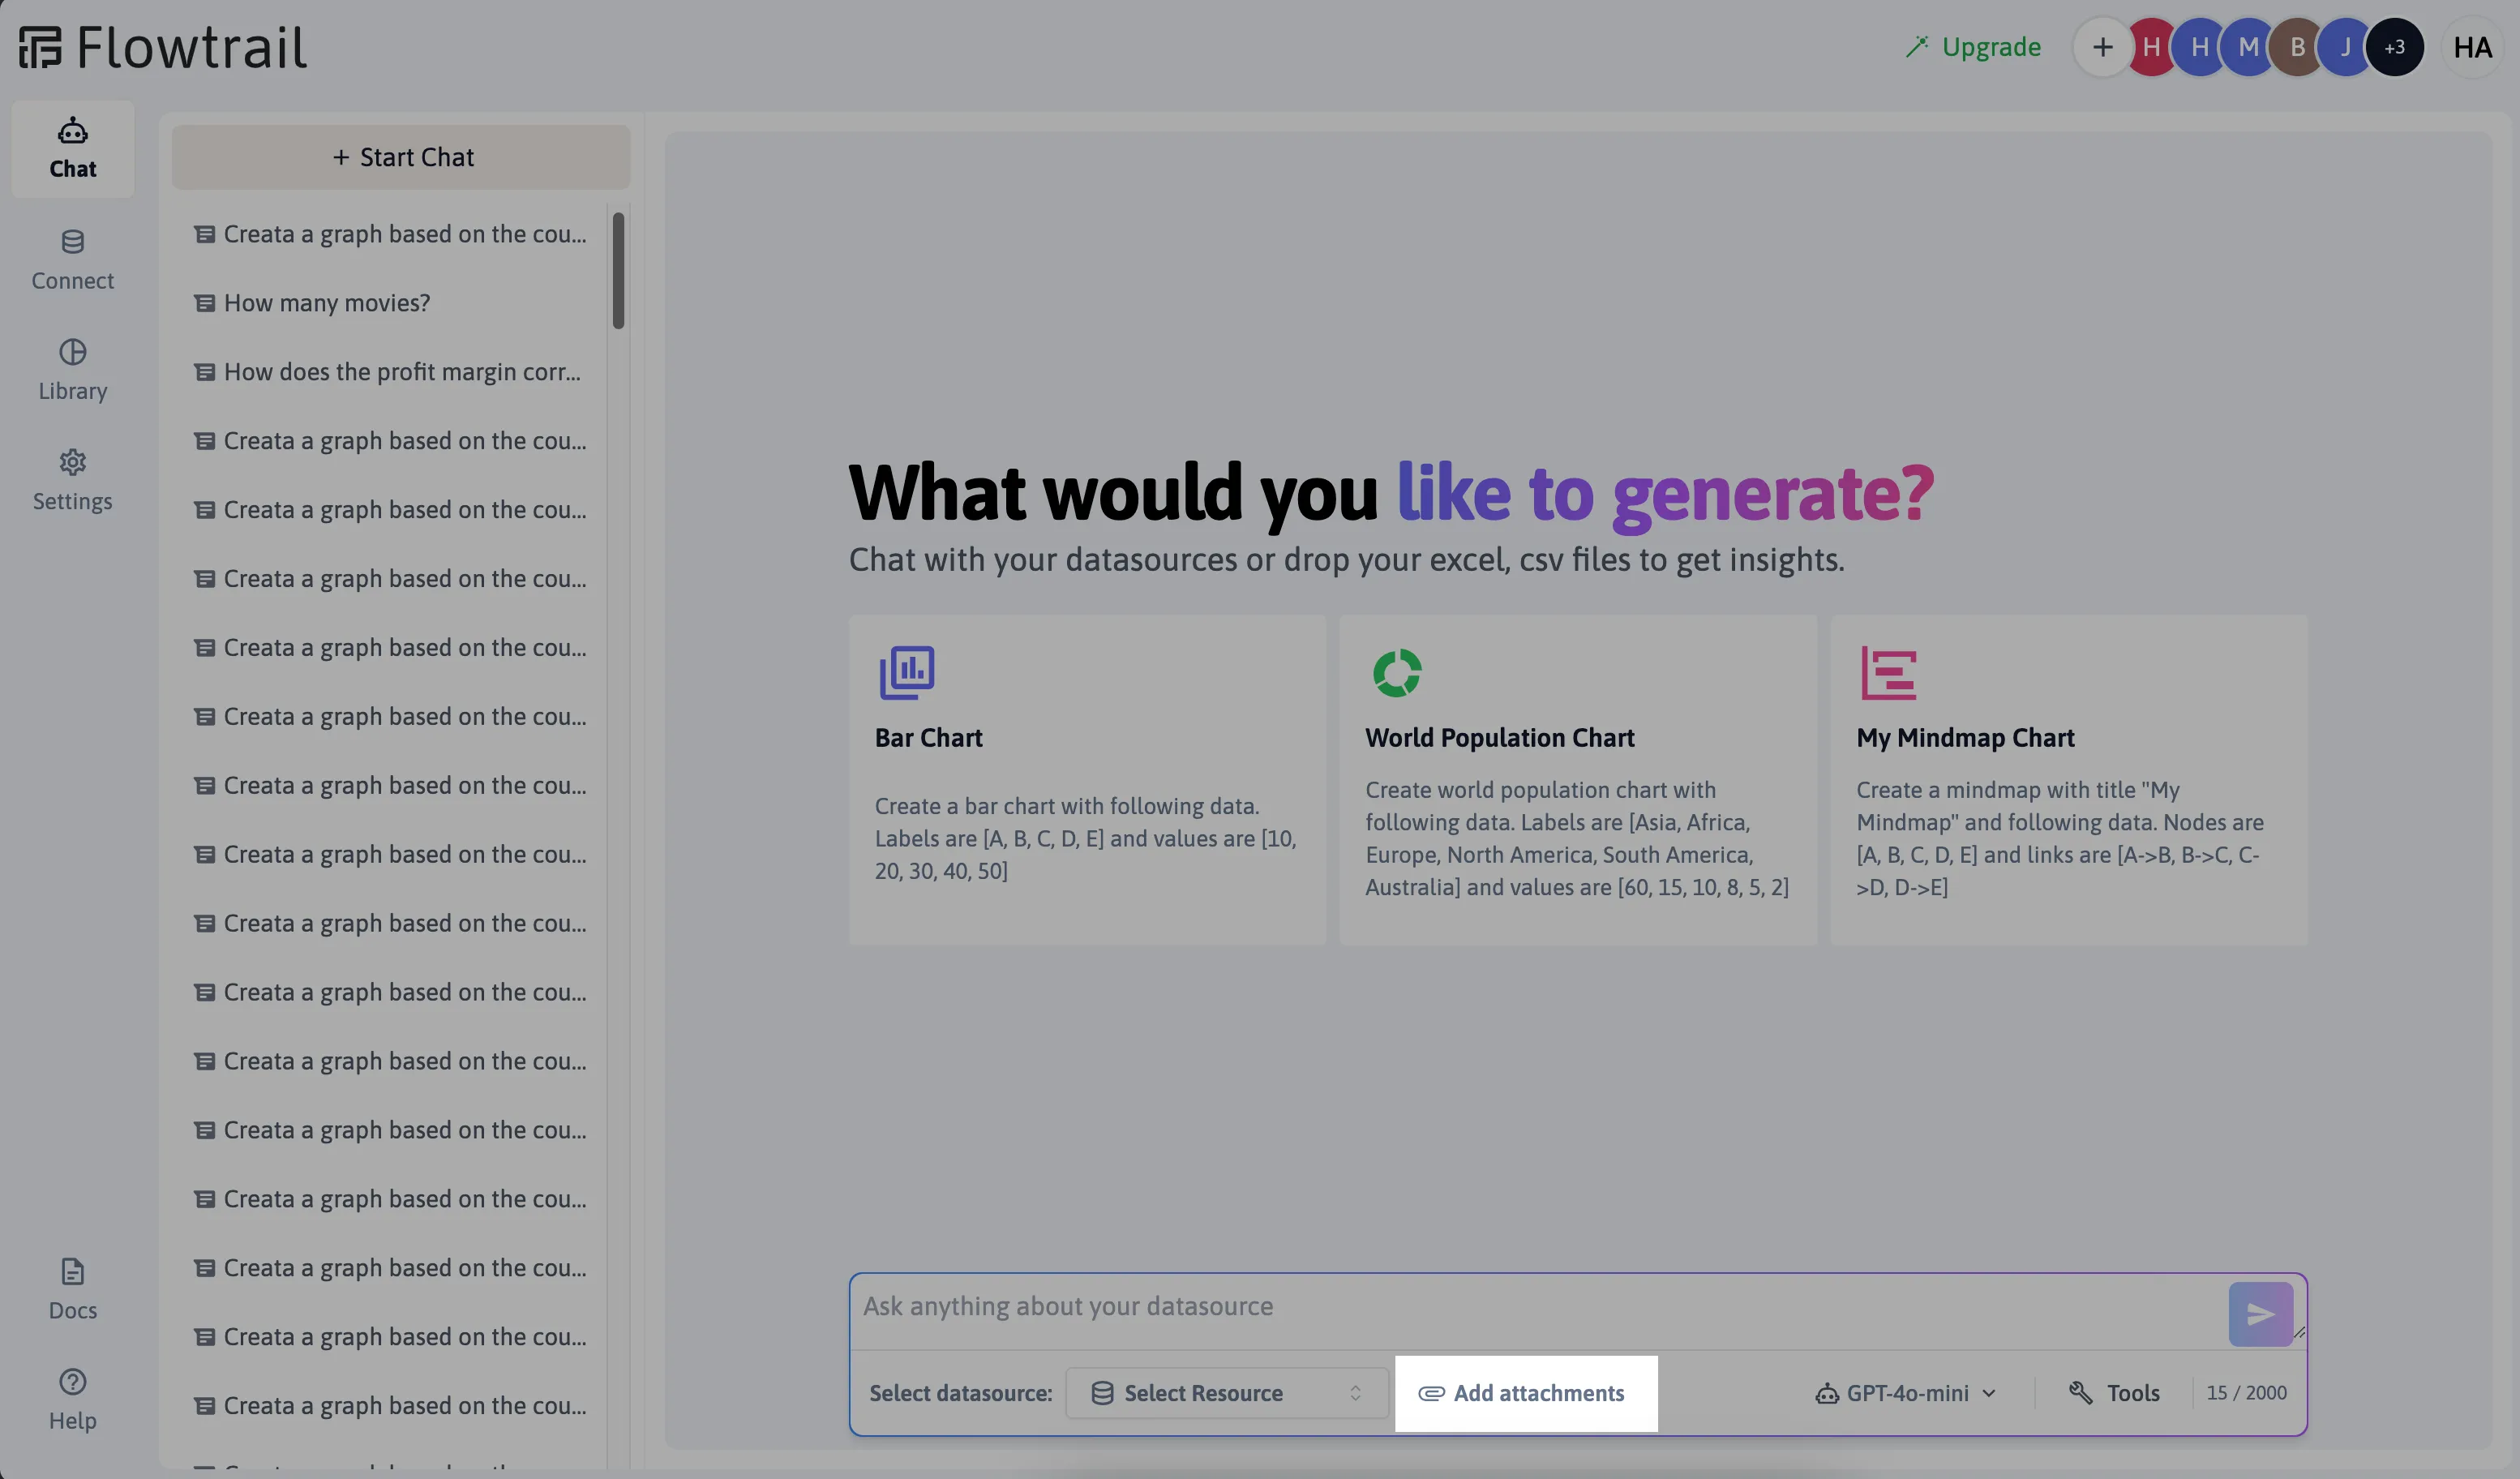
Upload File
Start by uploading your Excel file. Each tab within the file will be treated as a separate dataset.
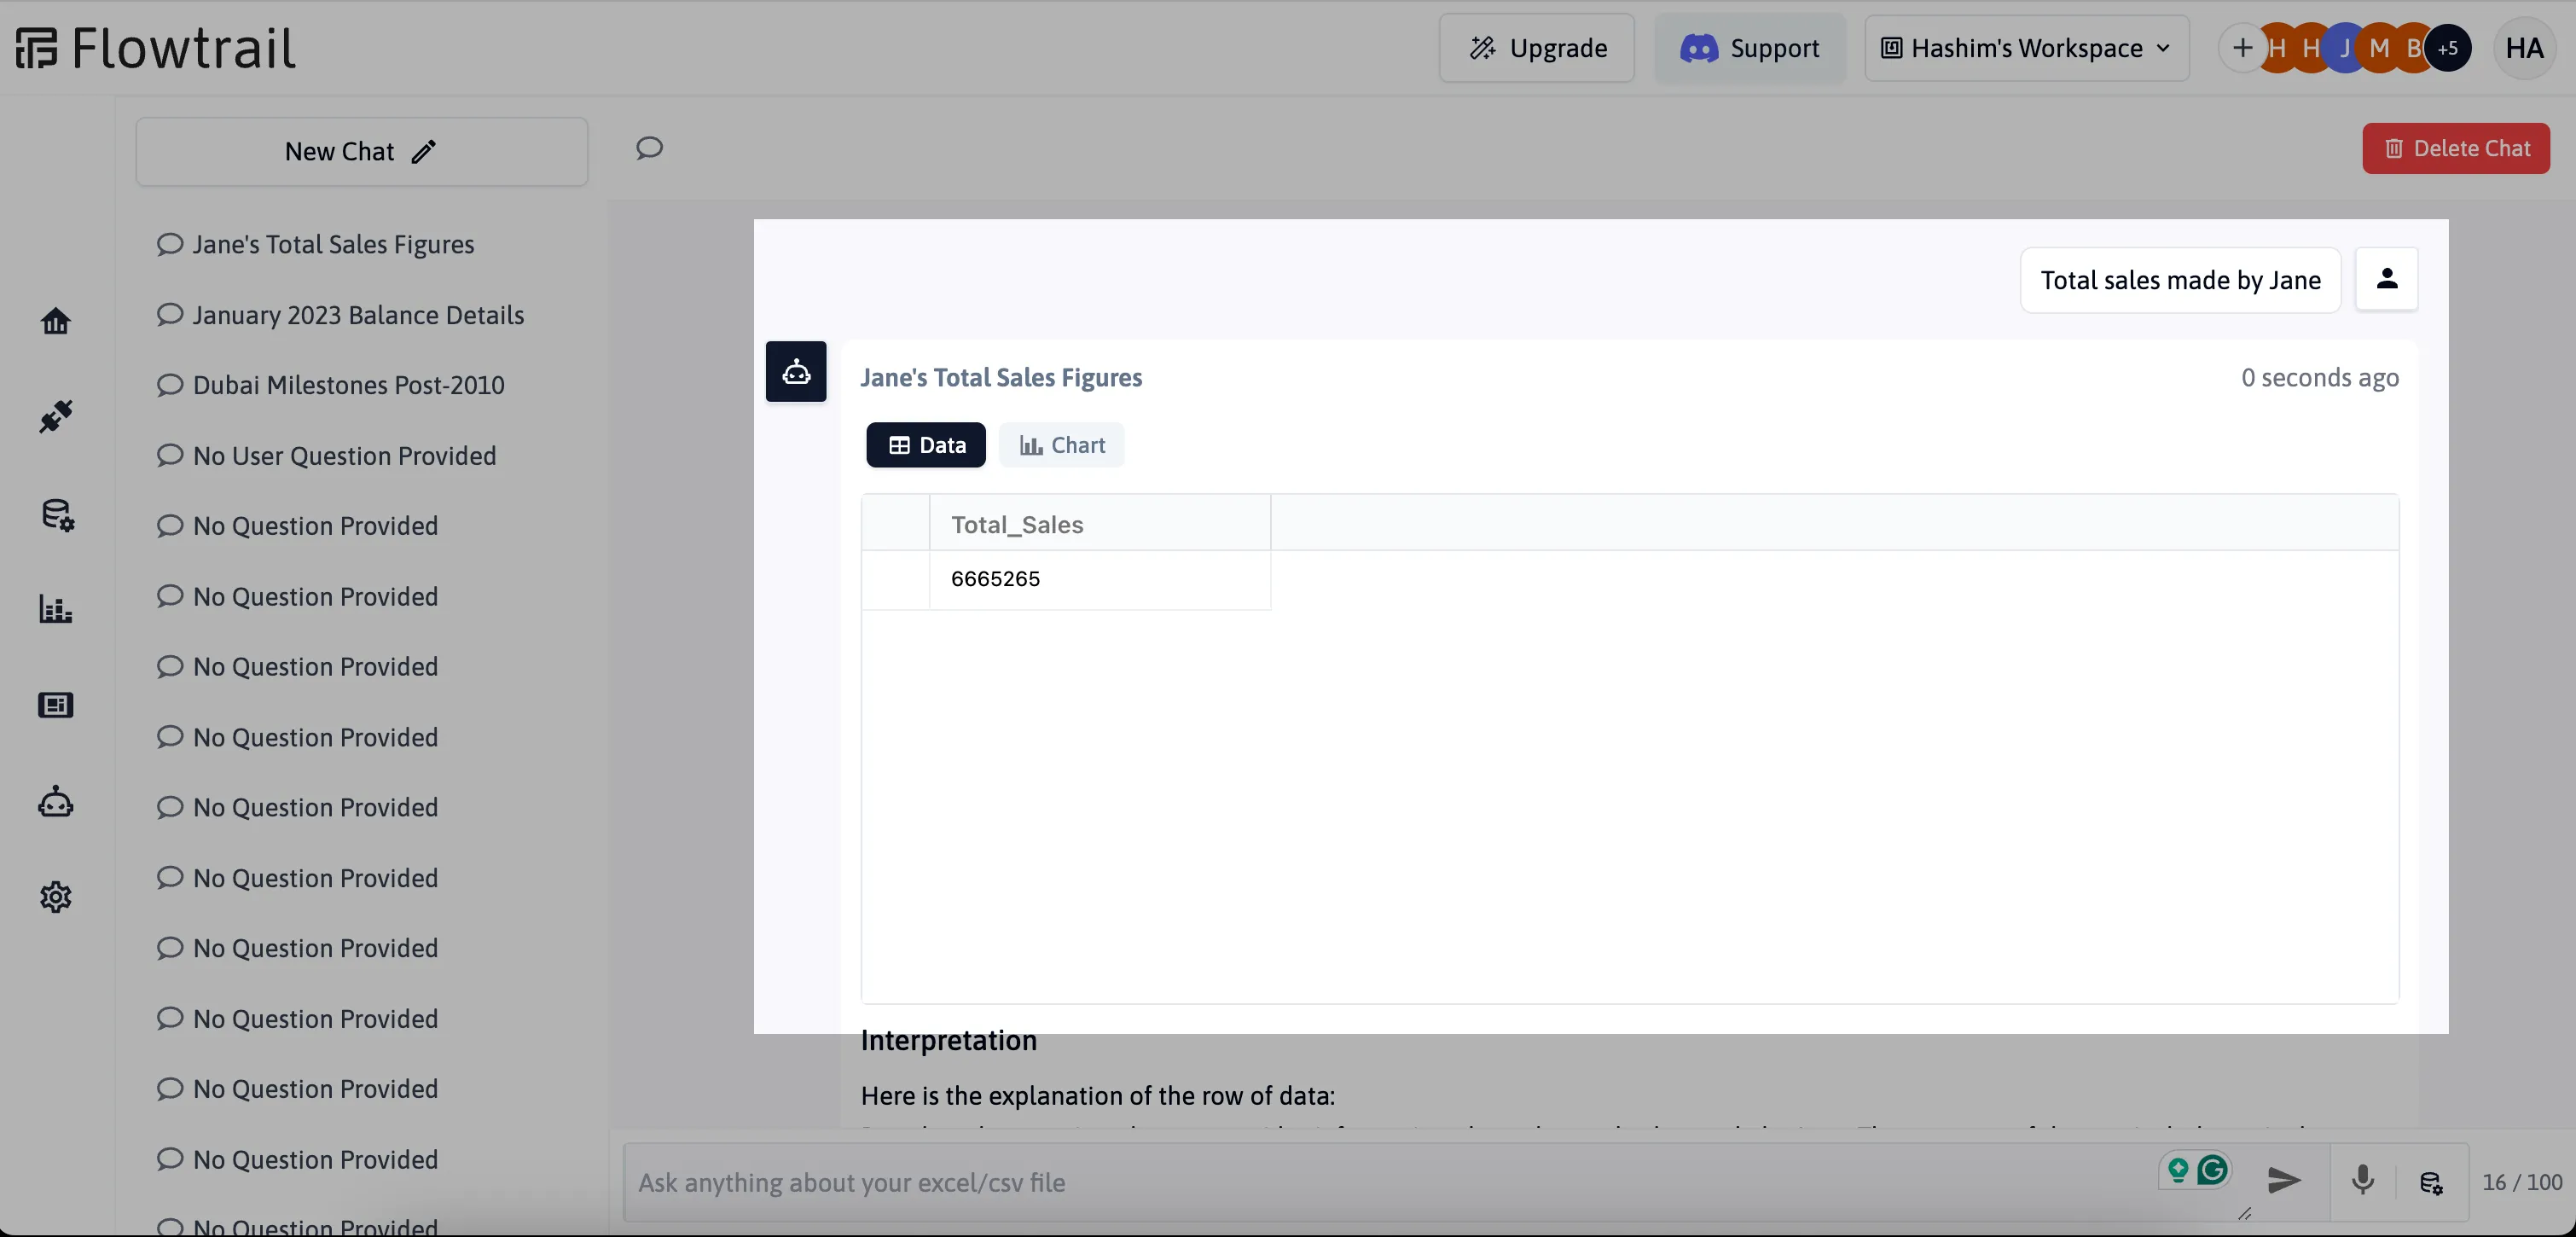
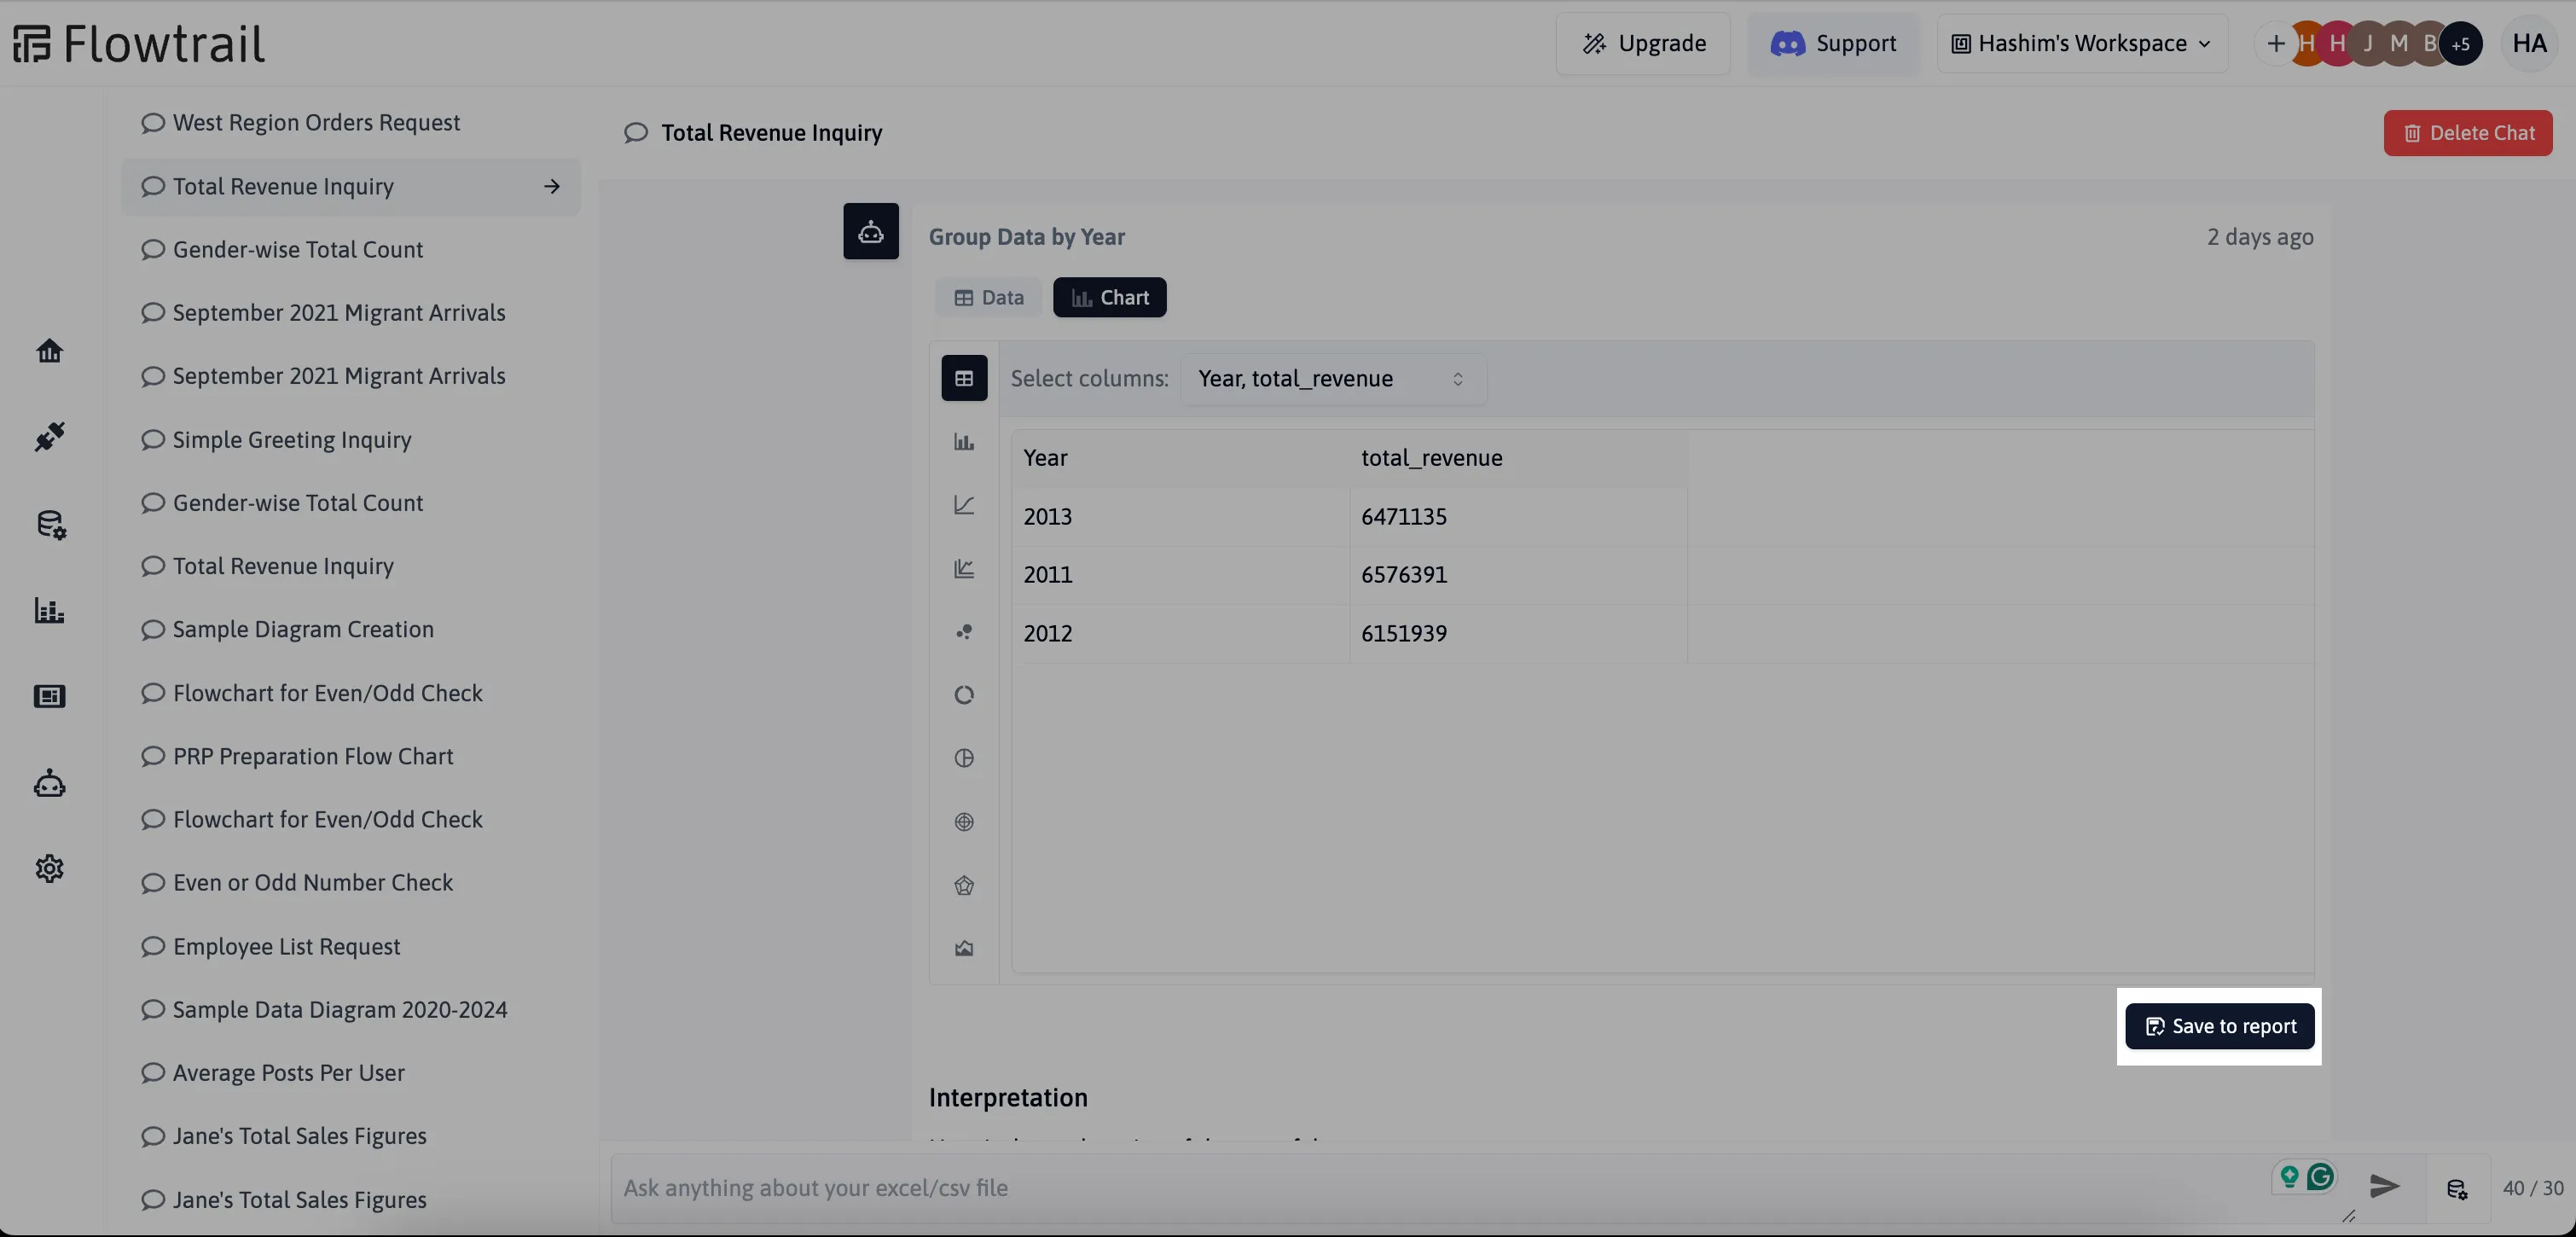
Asking Questions
Once descriptions are added, you can ask questions about your Excel data. Flowtrail AI will analyze the data and generate answers based on your queries.
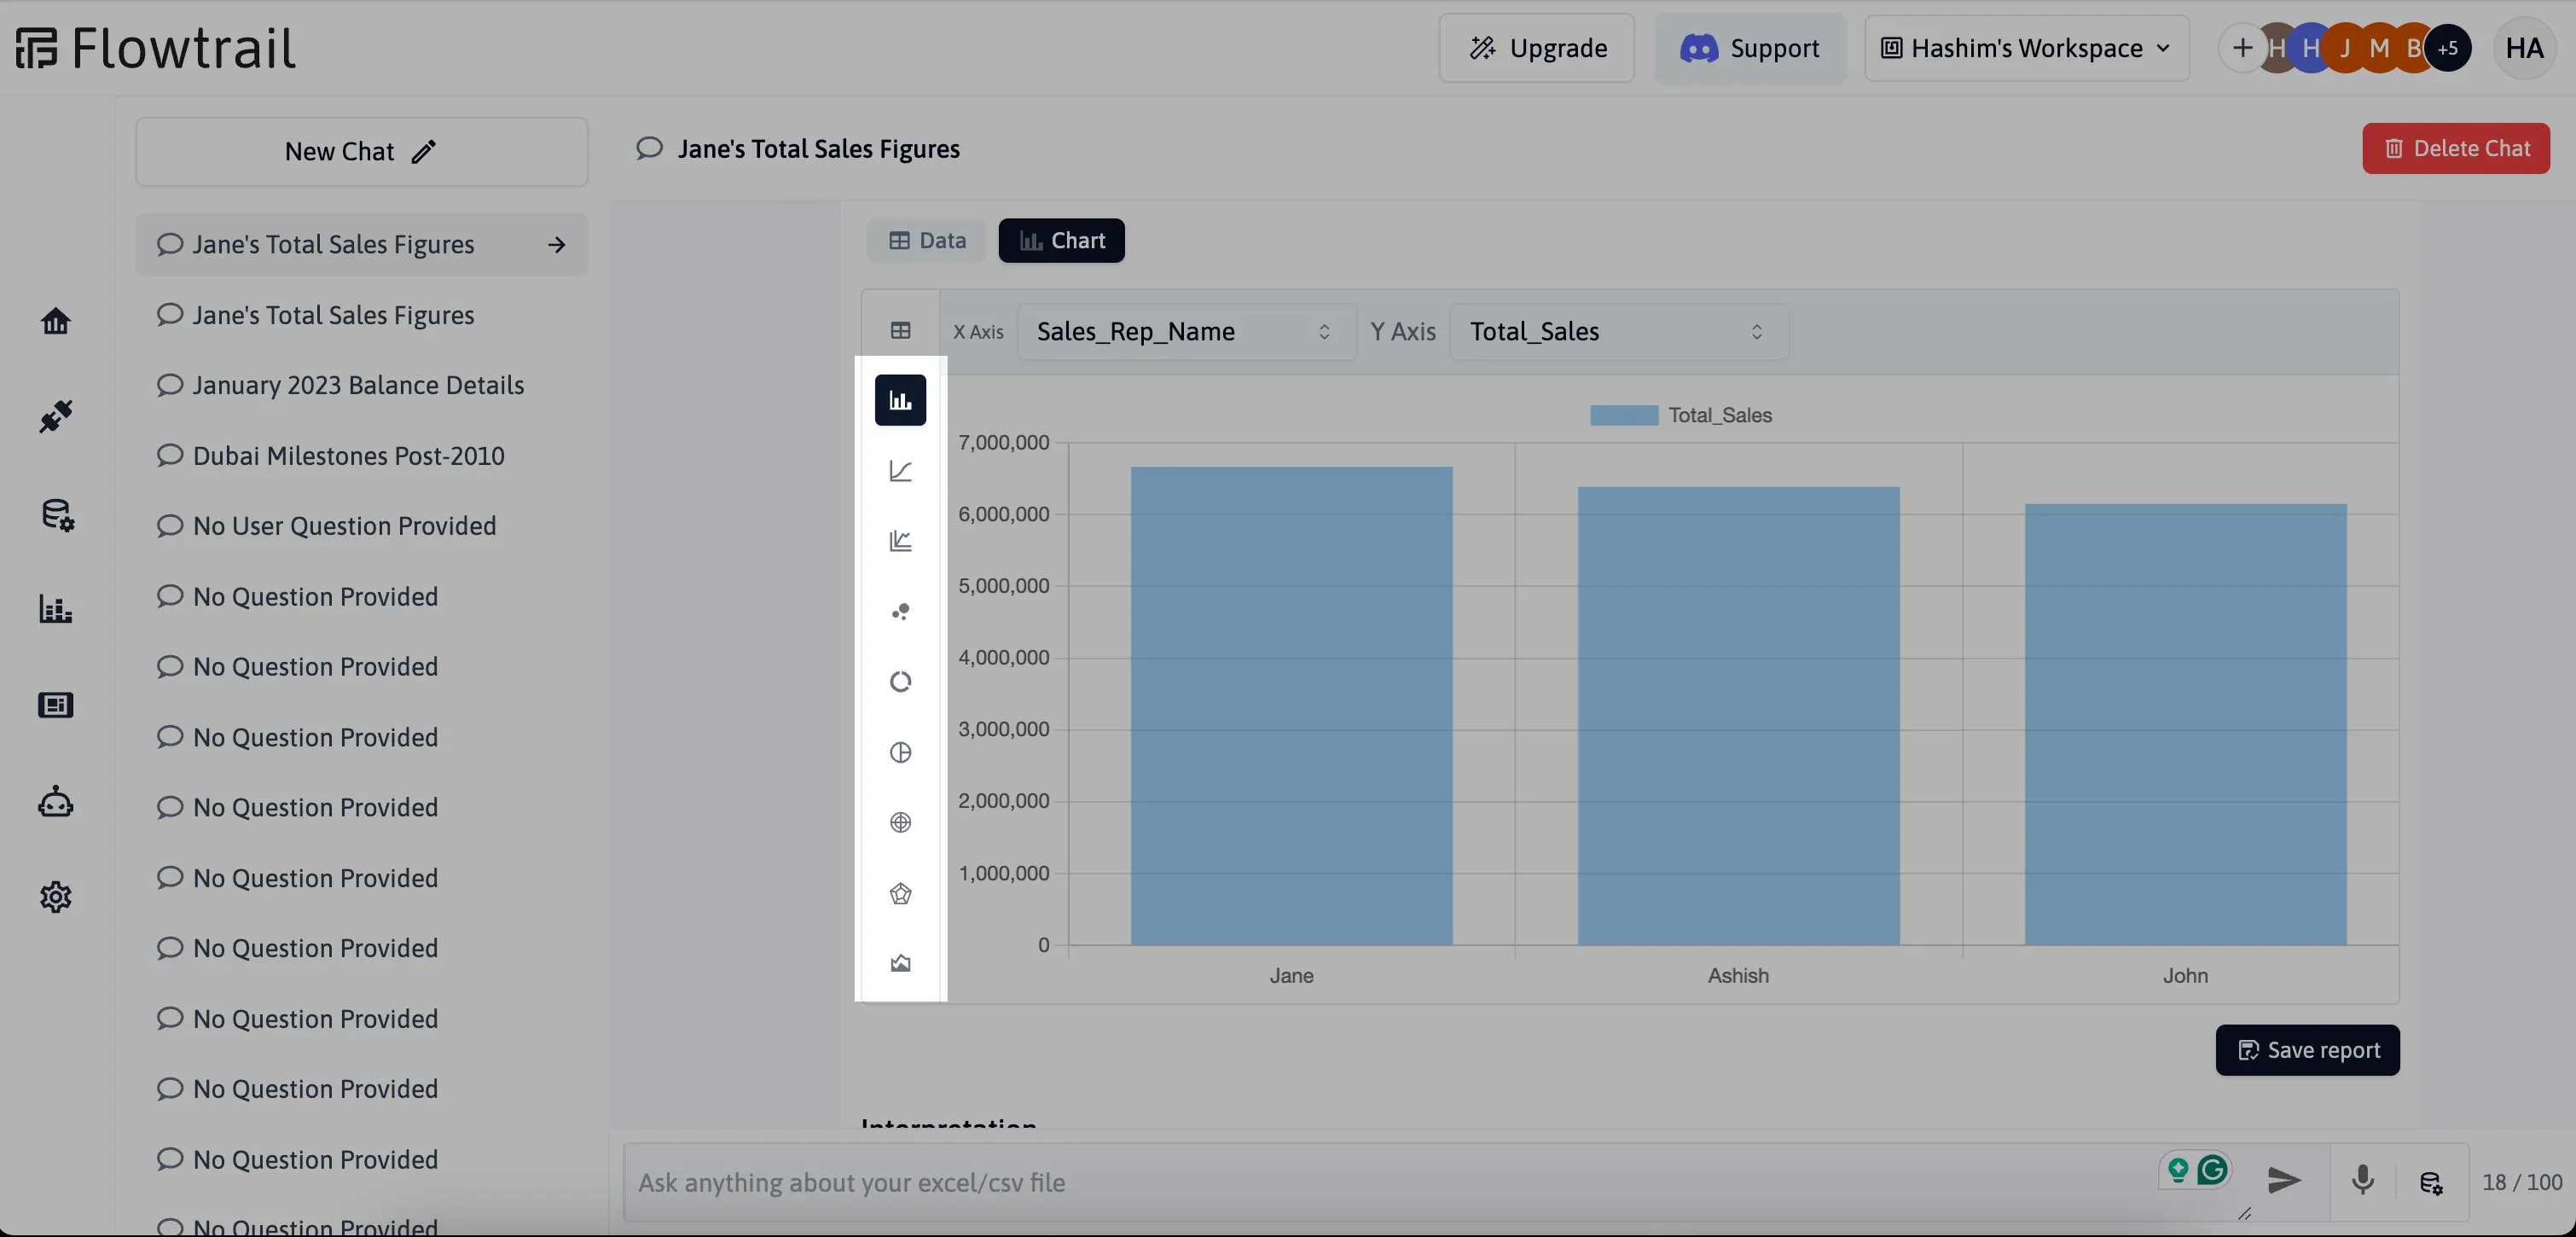
Visualizing Results
Visualize your data by selecting from various chart types, such as bar charts or pie charts. Once your chart is set up, save it directly to your reports and dashboards for easy access.
-
Choose Chart Types
After receiving the results, you can choose from various chart types to visualize the data. Options include bar charts, pie charts, and more.
-
Save to Reports and Dashboards
Once your report is generated, you can save it directly to your Flowtrail AI reports and dashboards for future reference.
The “Chat with Excel” feature in Flowtrail AI offers a powerful way to interact with your Excel data. By simply uploading your files, you can ask questions, visualize results with customizable charts, and save your findings to reports and dashboards. This seamless integration transforms your Excel files into dynamic datasets, enabling quick analysis and easy access to insights—all within the Flowtrail AI platform.