Create Dashboard
Flowtrail AI empowers you to create comprehensive dashboards that bring together multiple reports and visualizations into a single, unified view. This functionality enables you to see all relevant data at a glance, facilitating better decision-making and more efficient data analysis.
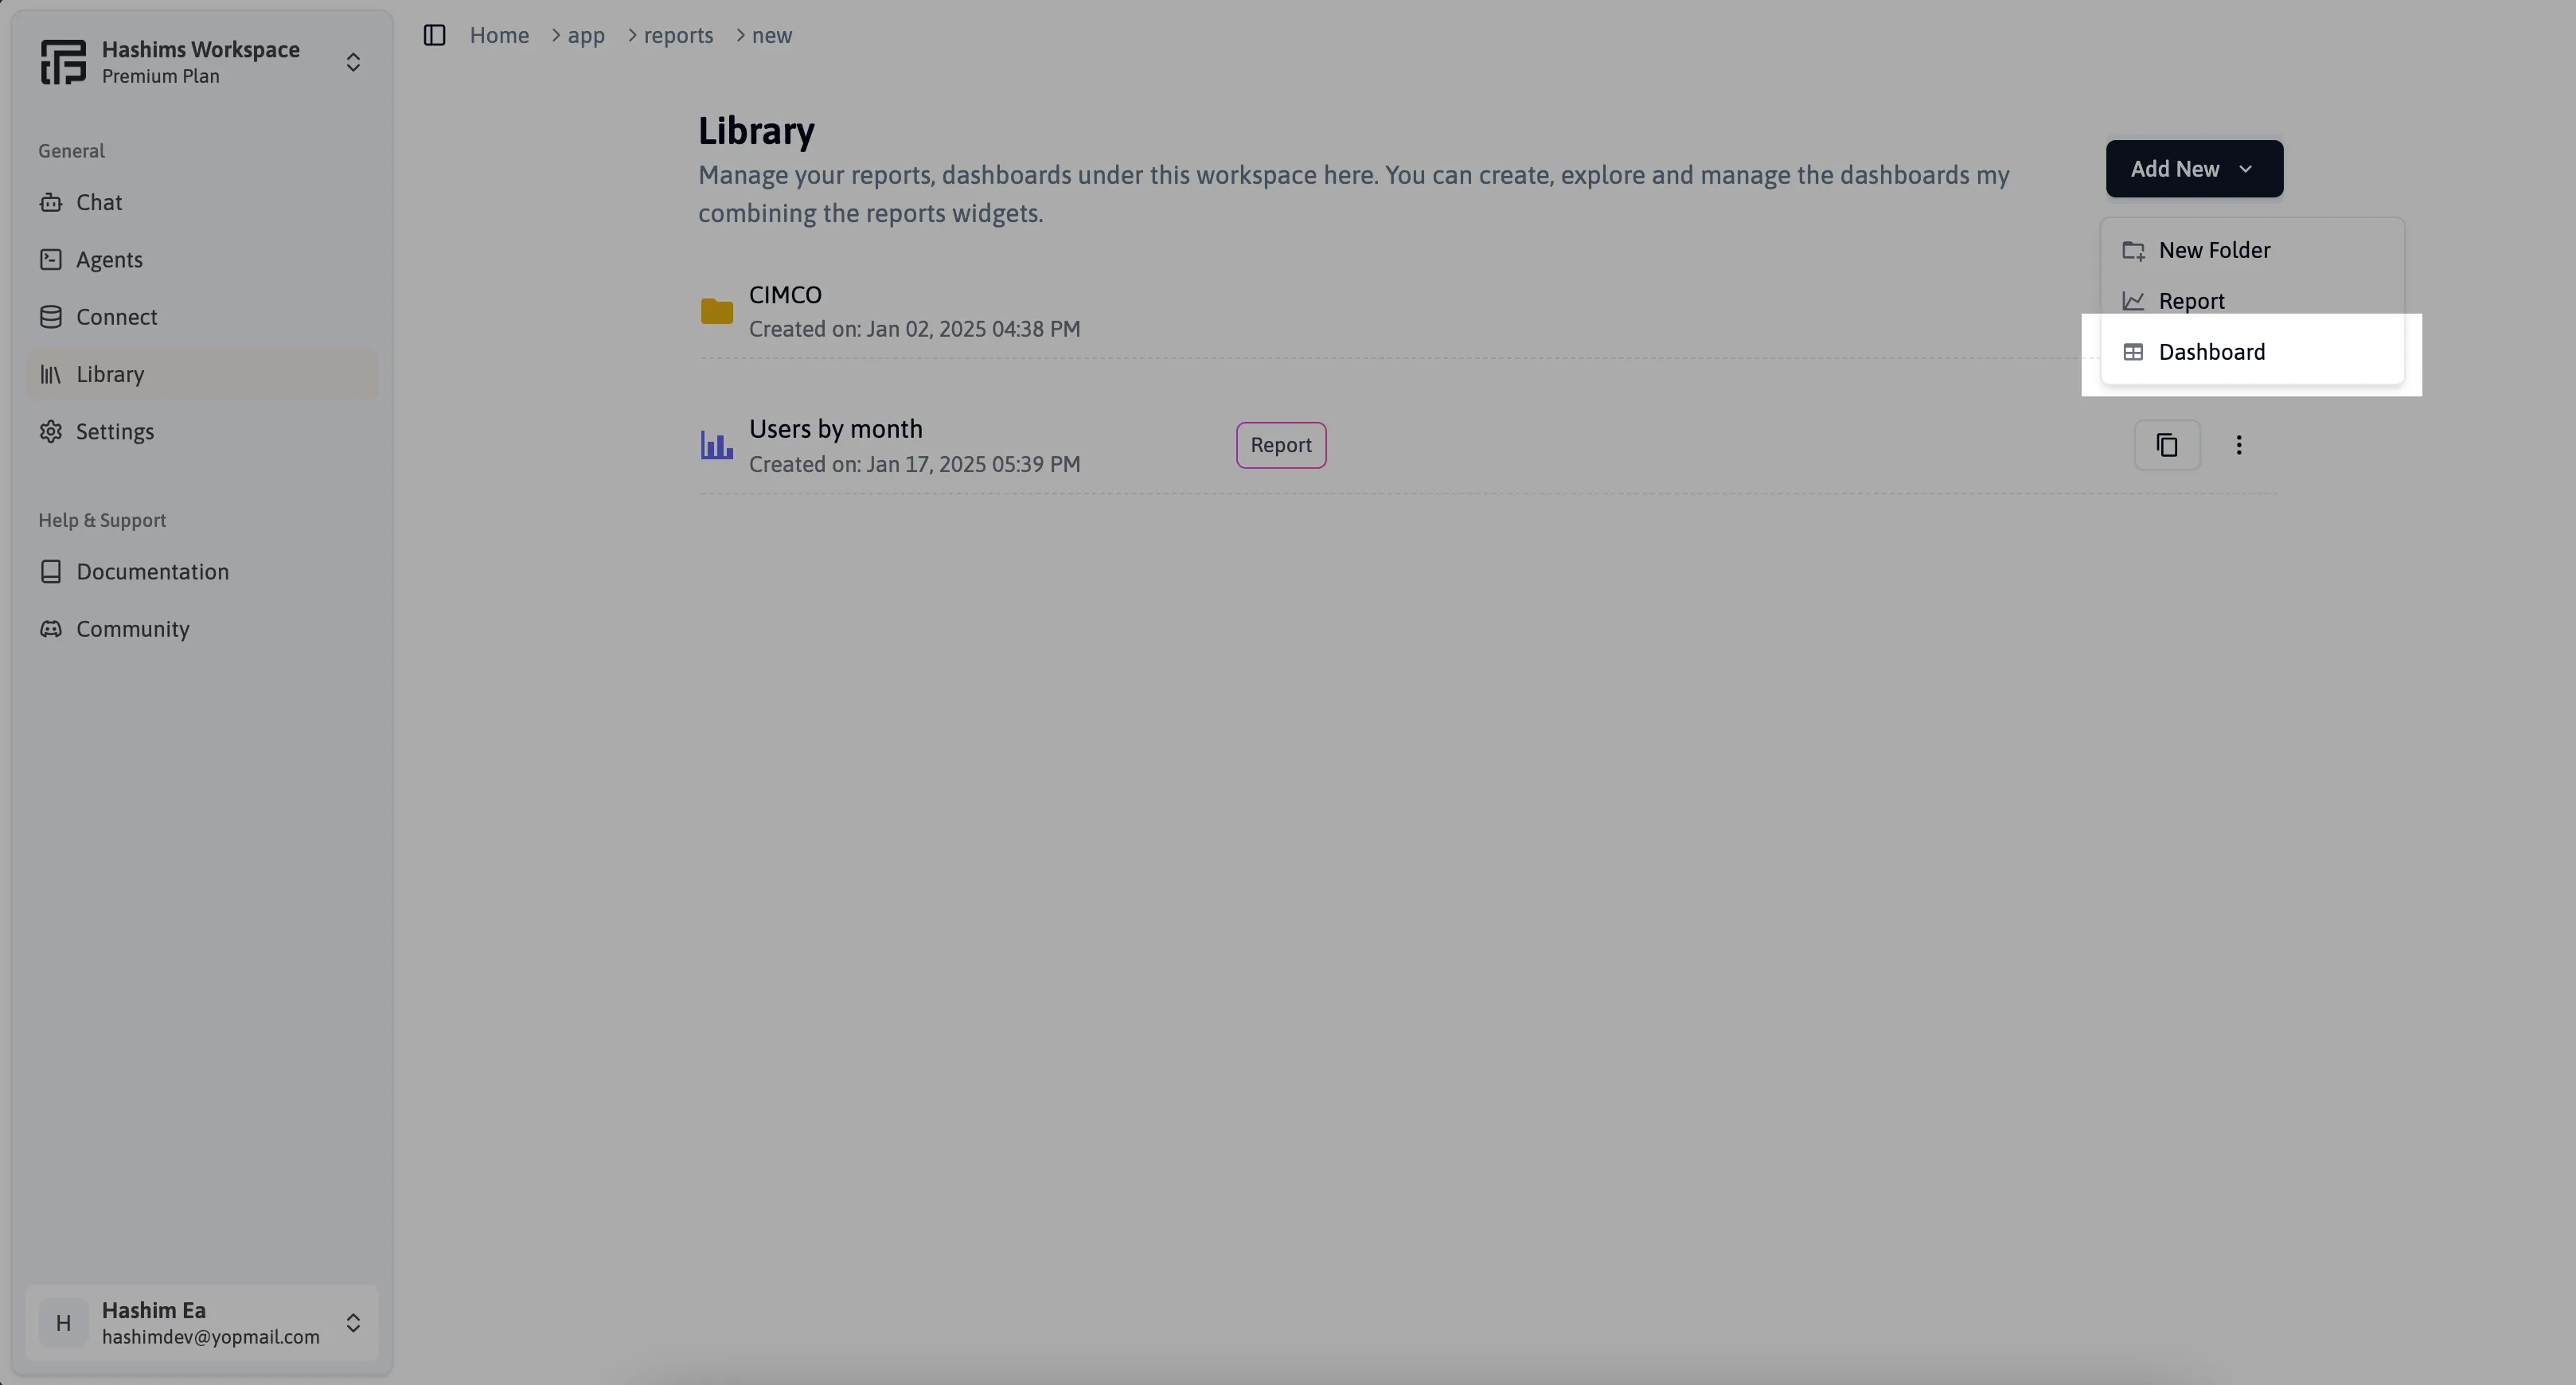
Create a Dashboard
Click on the Add Dashboard button to navigate to the dashboard creation screen. Here, you can add and arrange reports, customize the layout, and save your dashboard for future use.
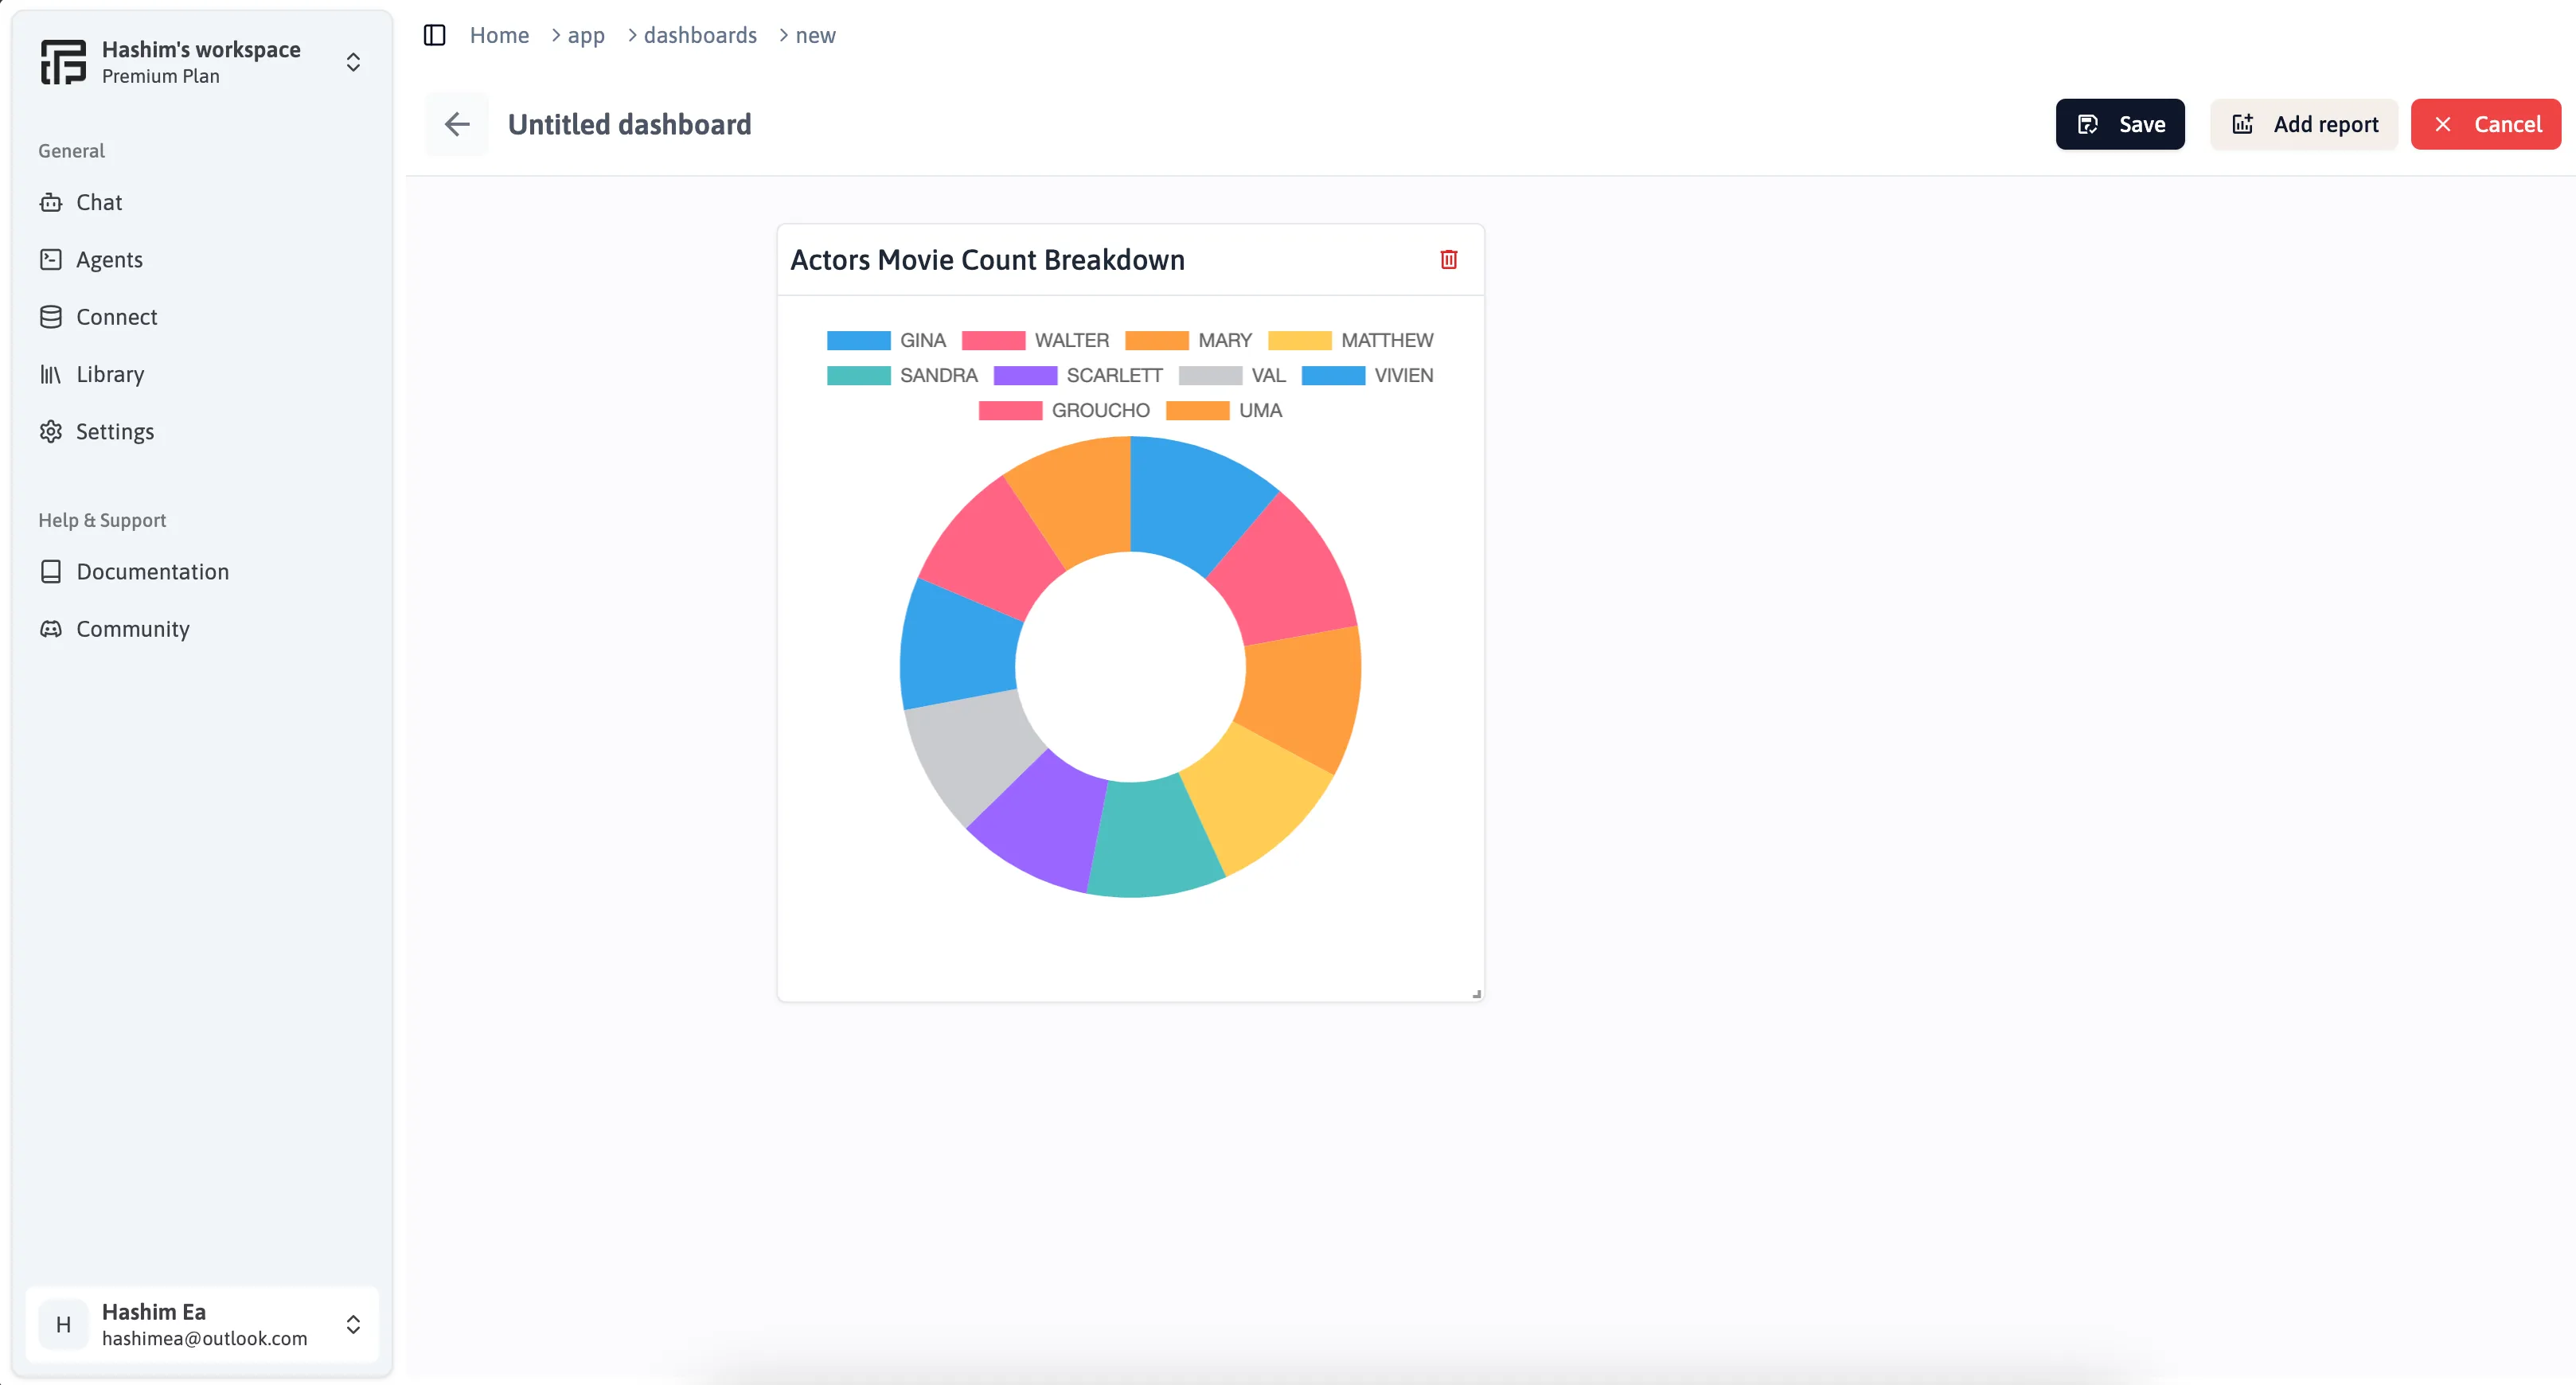
The dashboard creation page allows you to add and organize reports and visualizations, customize the layout, and configure interactive elements. Use the drag-and-drop interface to position widgets and adjust their properties to create a tailored, informative dashboard
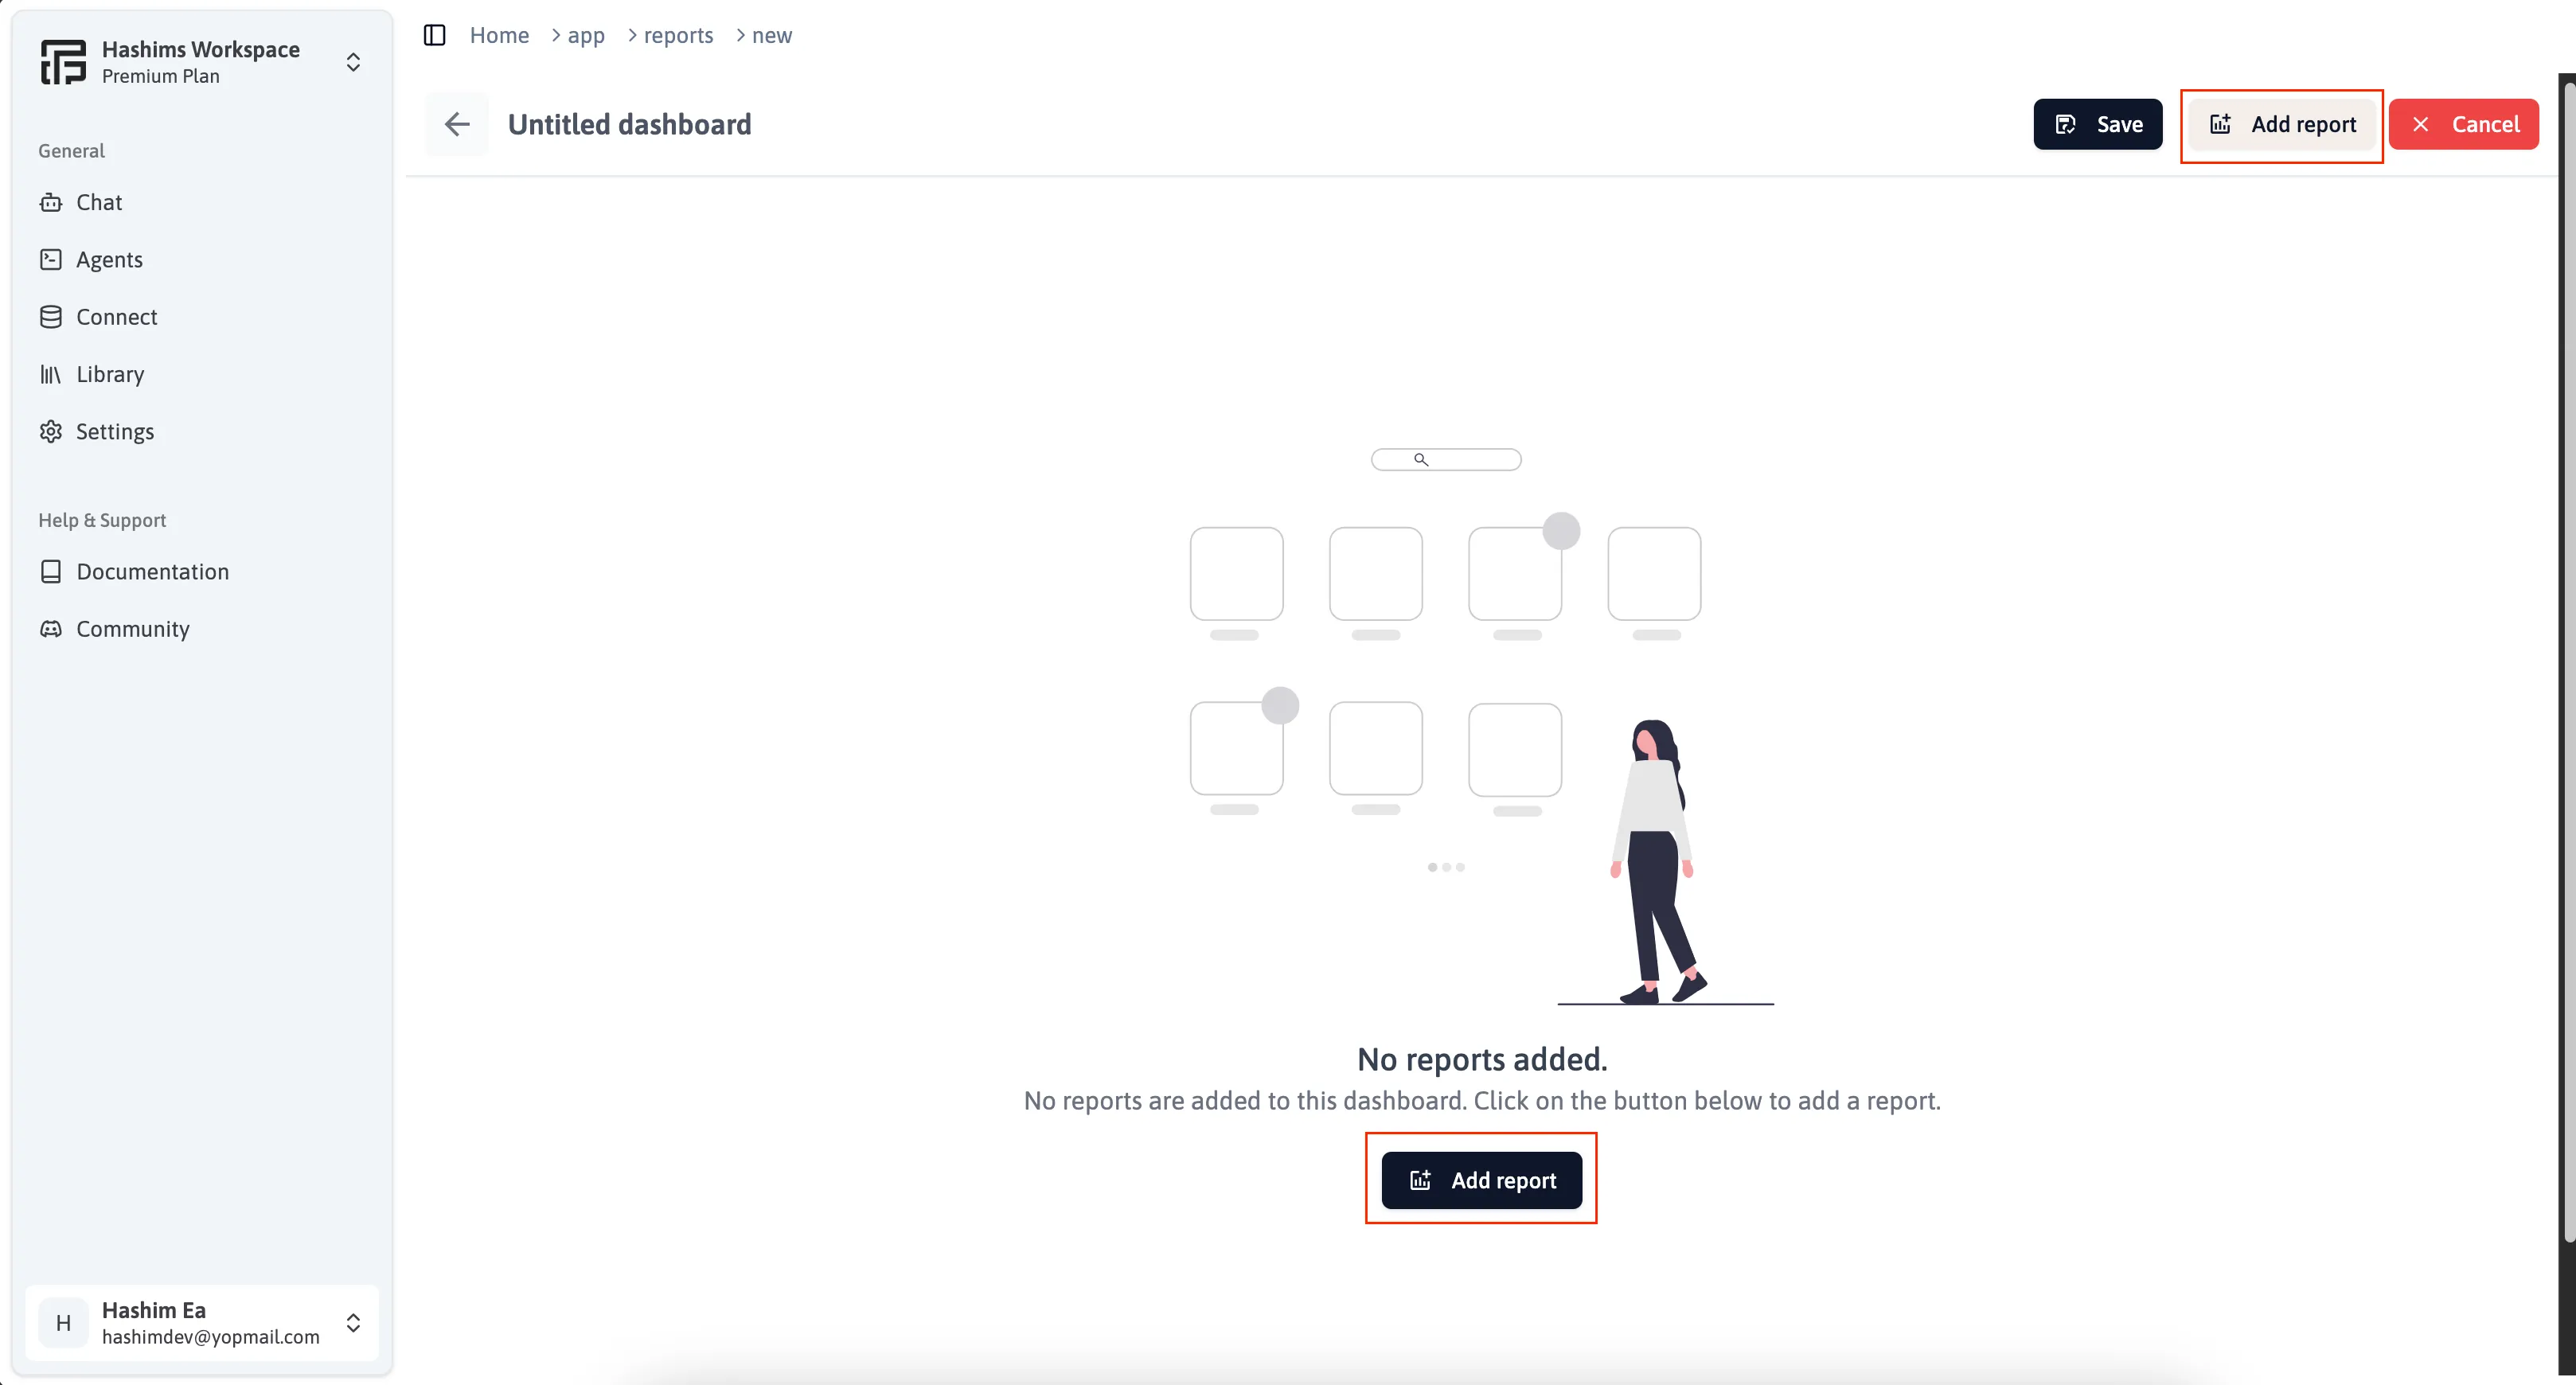
Add Reports
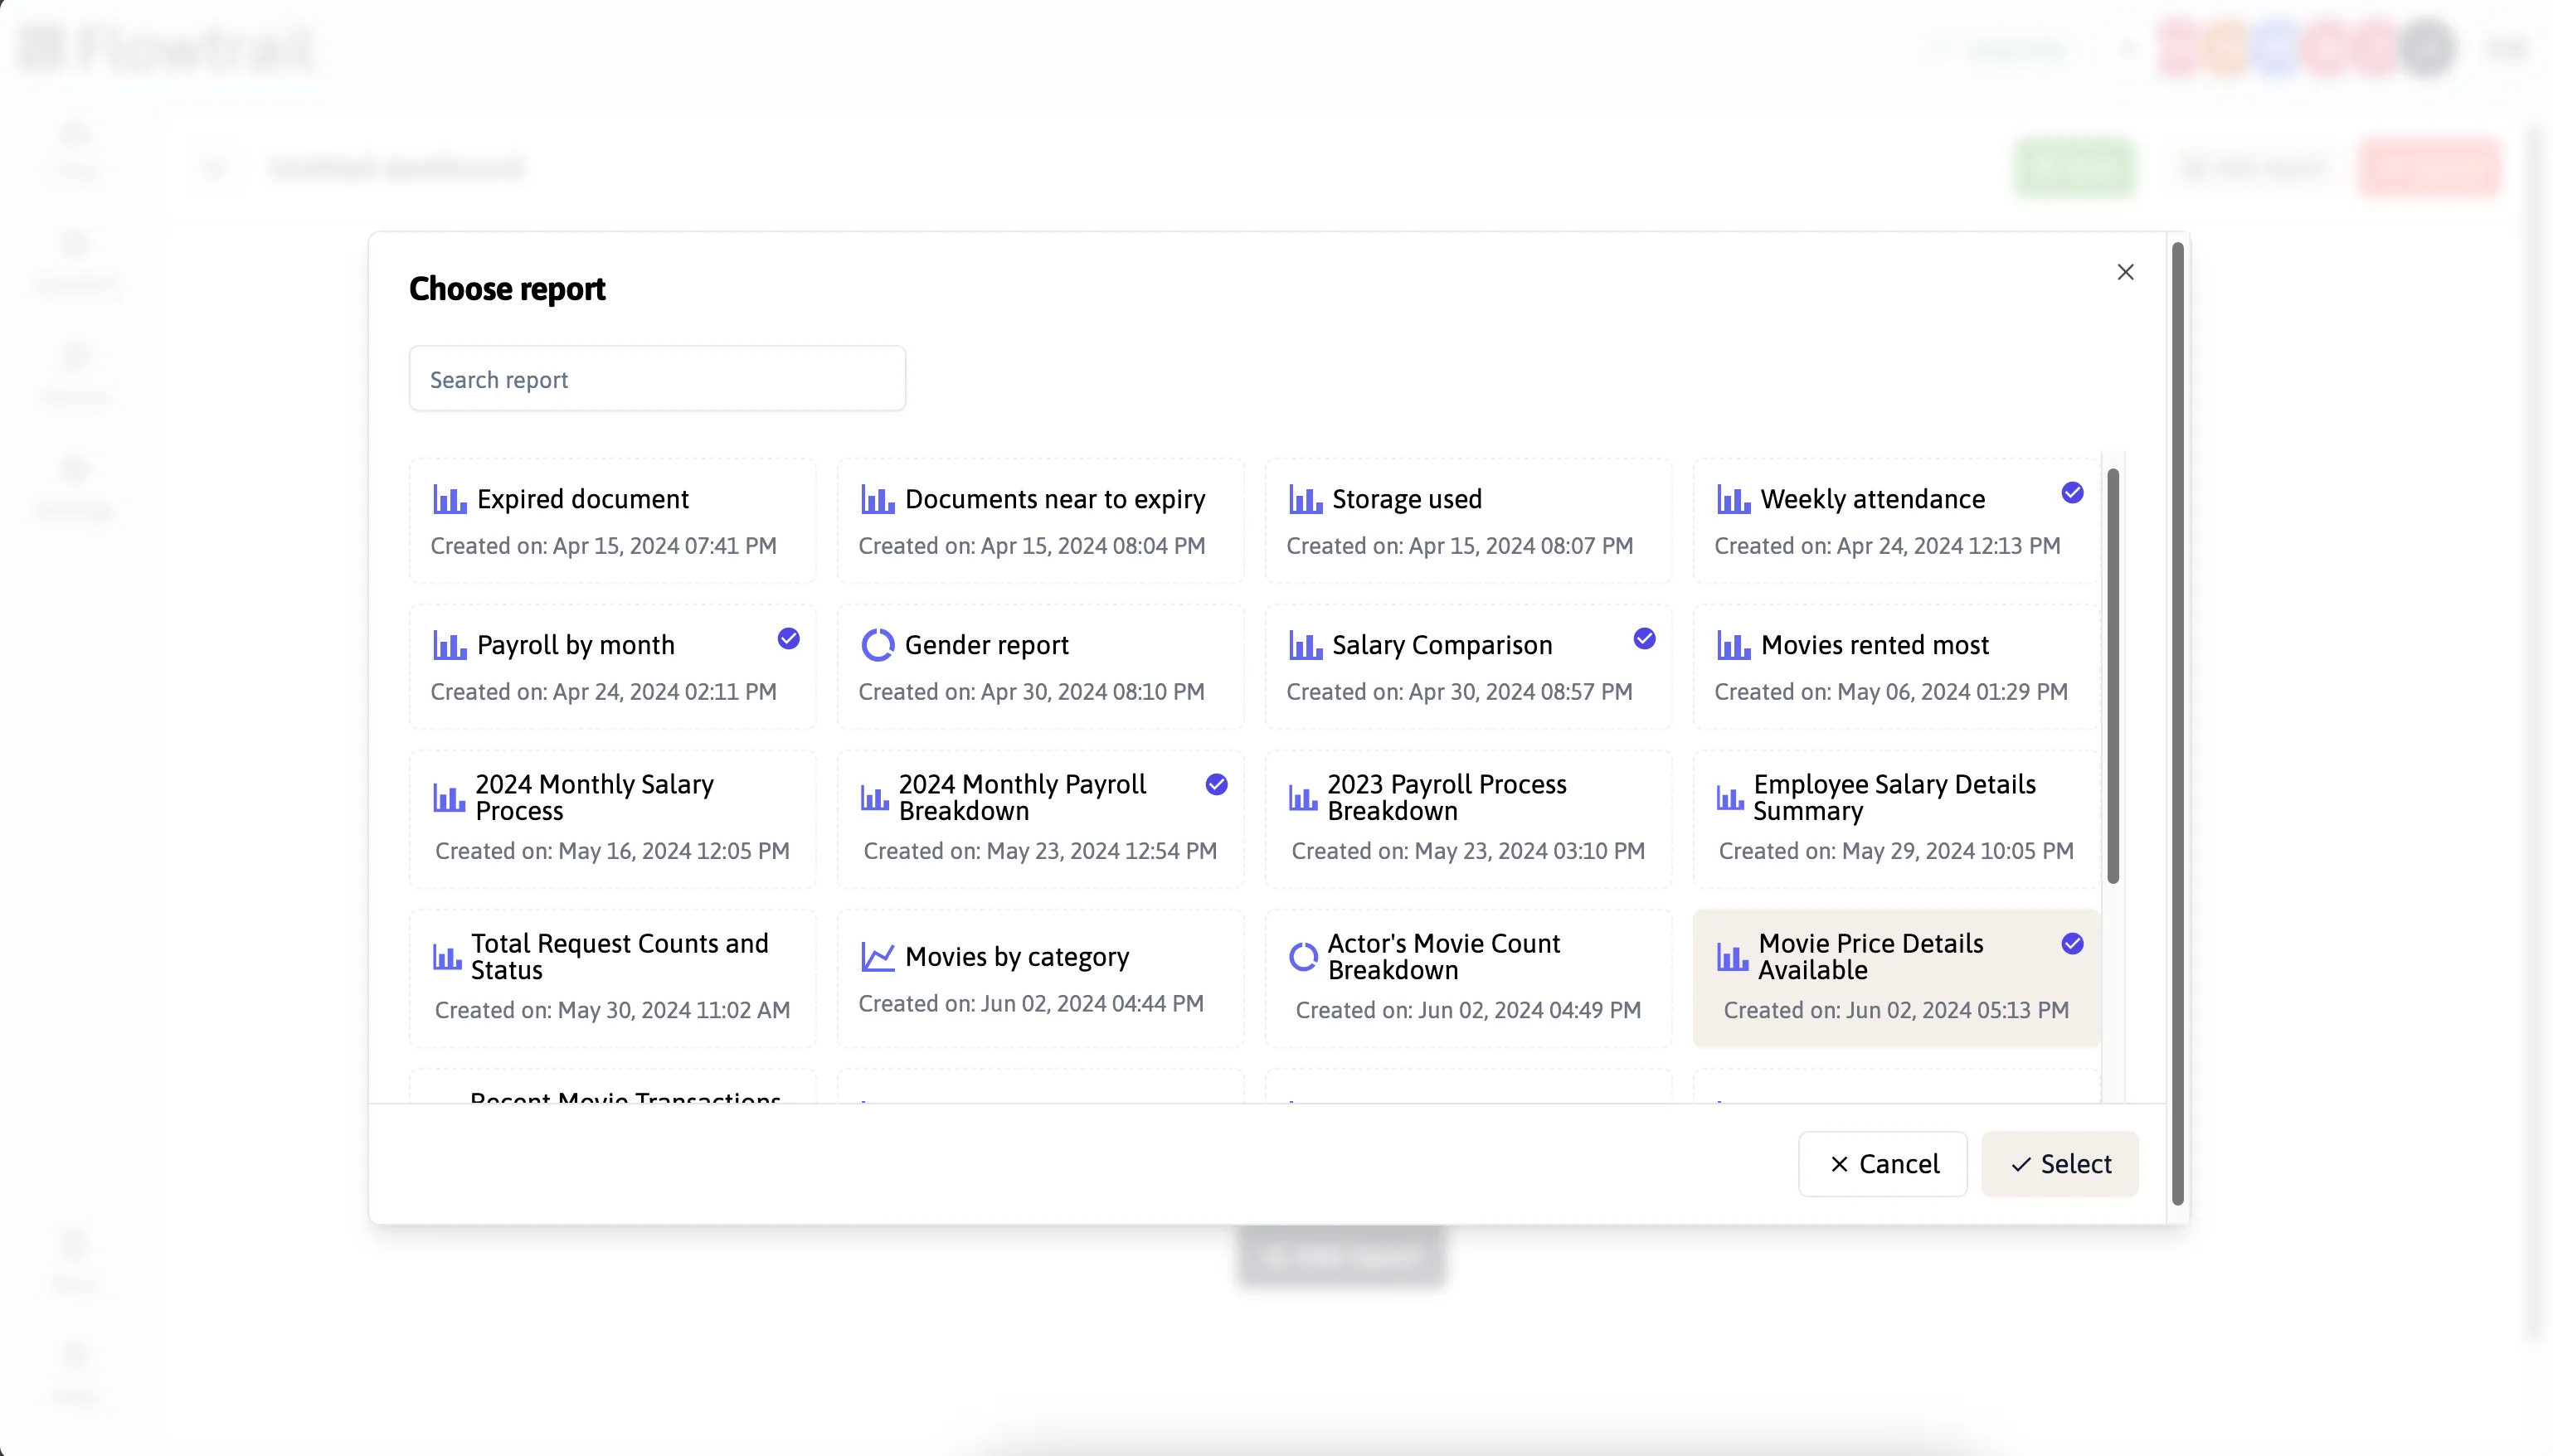
Select and add saved reports by clicking the Add Reports button. This allows you to easily choose and incorporate the reports and visualizations you need into your dashboard.
You’ll see a comprehensive list of reports you’ve created, organized by folders for easy navigation. Select the right reports for your dashboard, adding as many as you need to create a customized view of your data.
Customize the Layout
Optimize your dashboard’s appearance and functionality using Flowtrail AI’s drag-and-drop interface. Easily arrange and resize reports and visualizations for a clear and organized presentation of your data insights
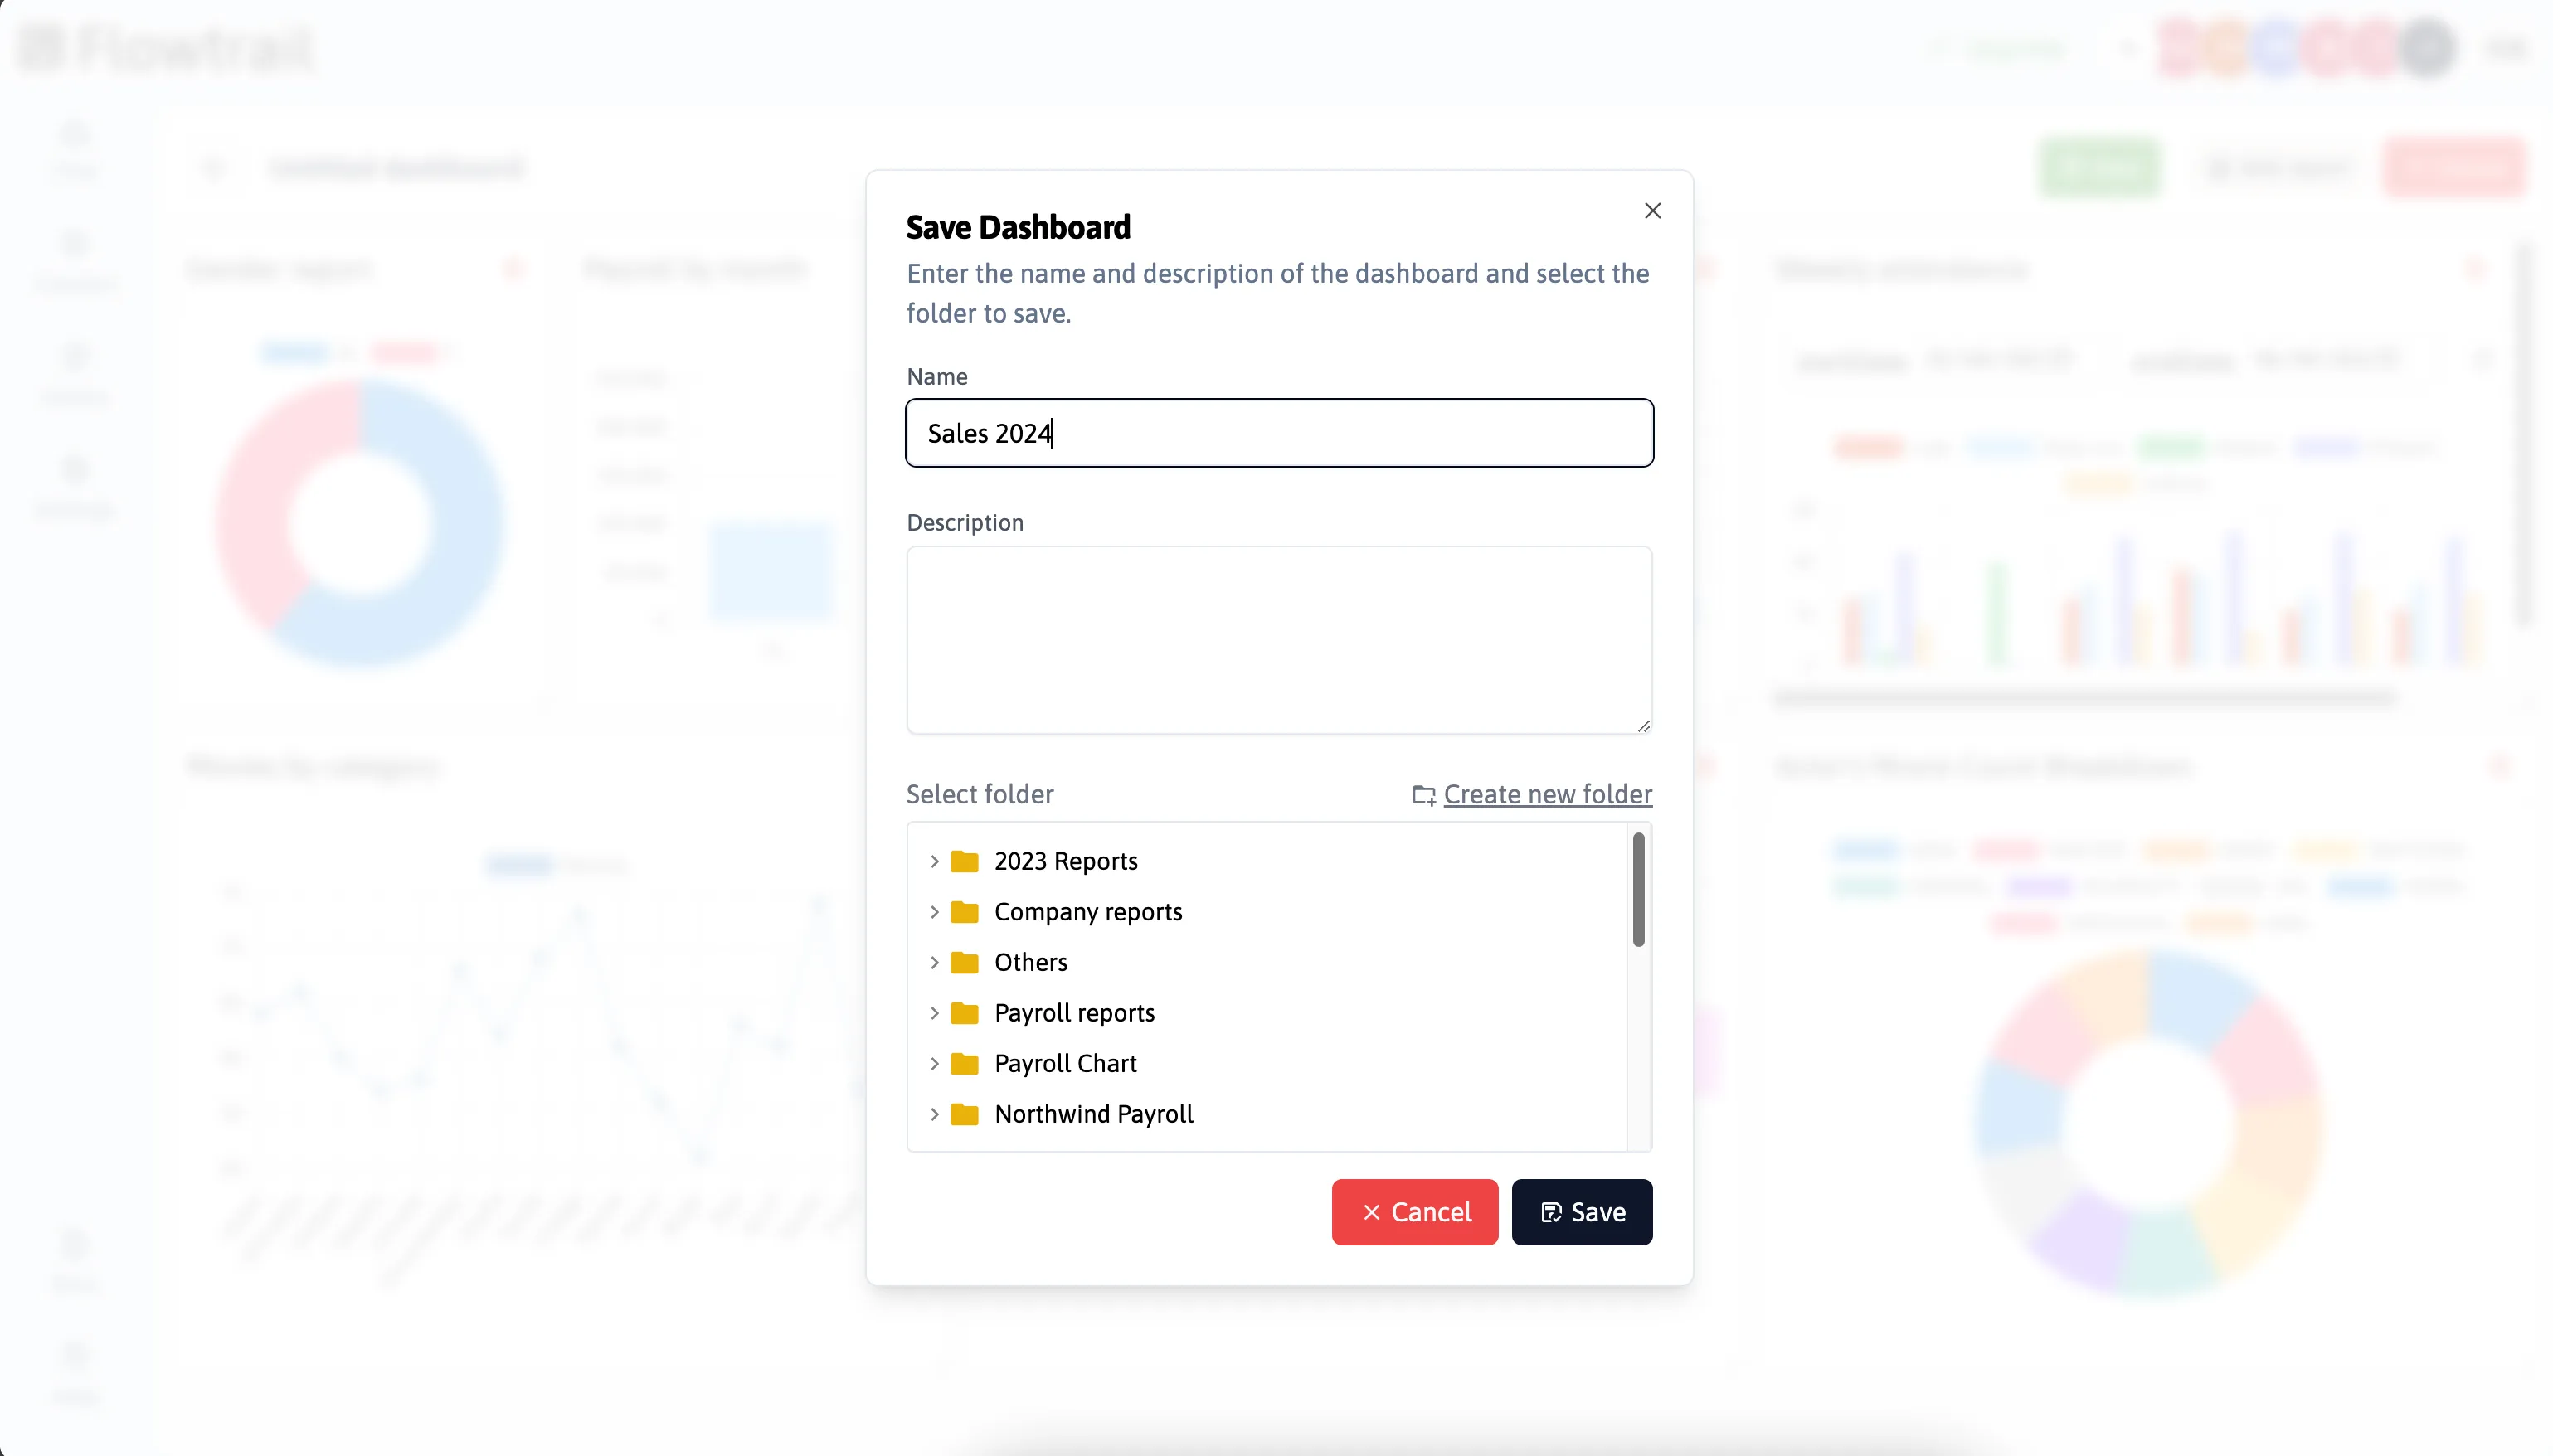
Save the Dashboard:
Once you are satisfied with the layout and content, save your dashboard by clicking the Save button. You can organize your dashboards into folders for better management and access.