Table Reports
Create detailed table reports in Flowtrail AI by selecting a dataset, fetching the data, and configuring the columns. Add, edit, delete, or hide columns to tailor the report to your specific needs, ensuring a clear and organized presentation of your data.
Create a Table Report
Run your query
The query can be generated using text 2 SQL or you can add your query to the query field, and then you can run the query to get the column information, and the details will be automatically loaded into the database
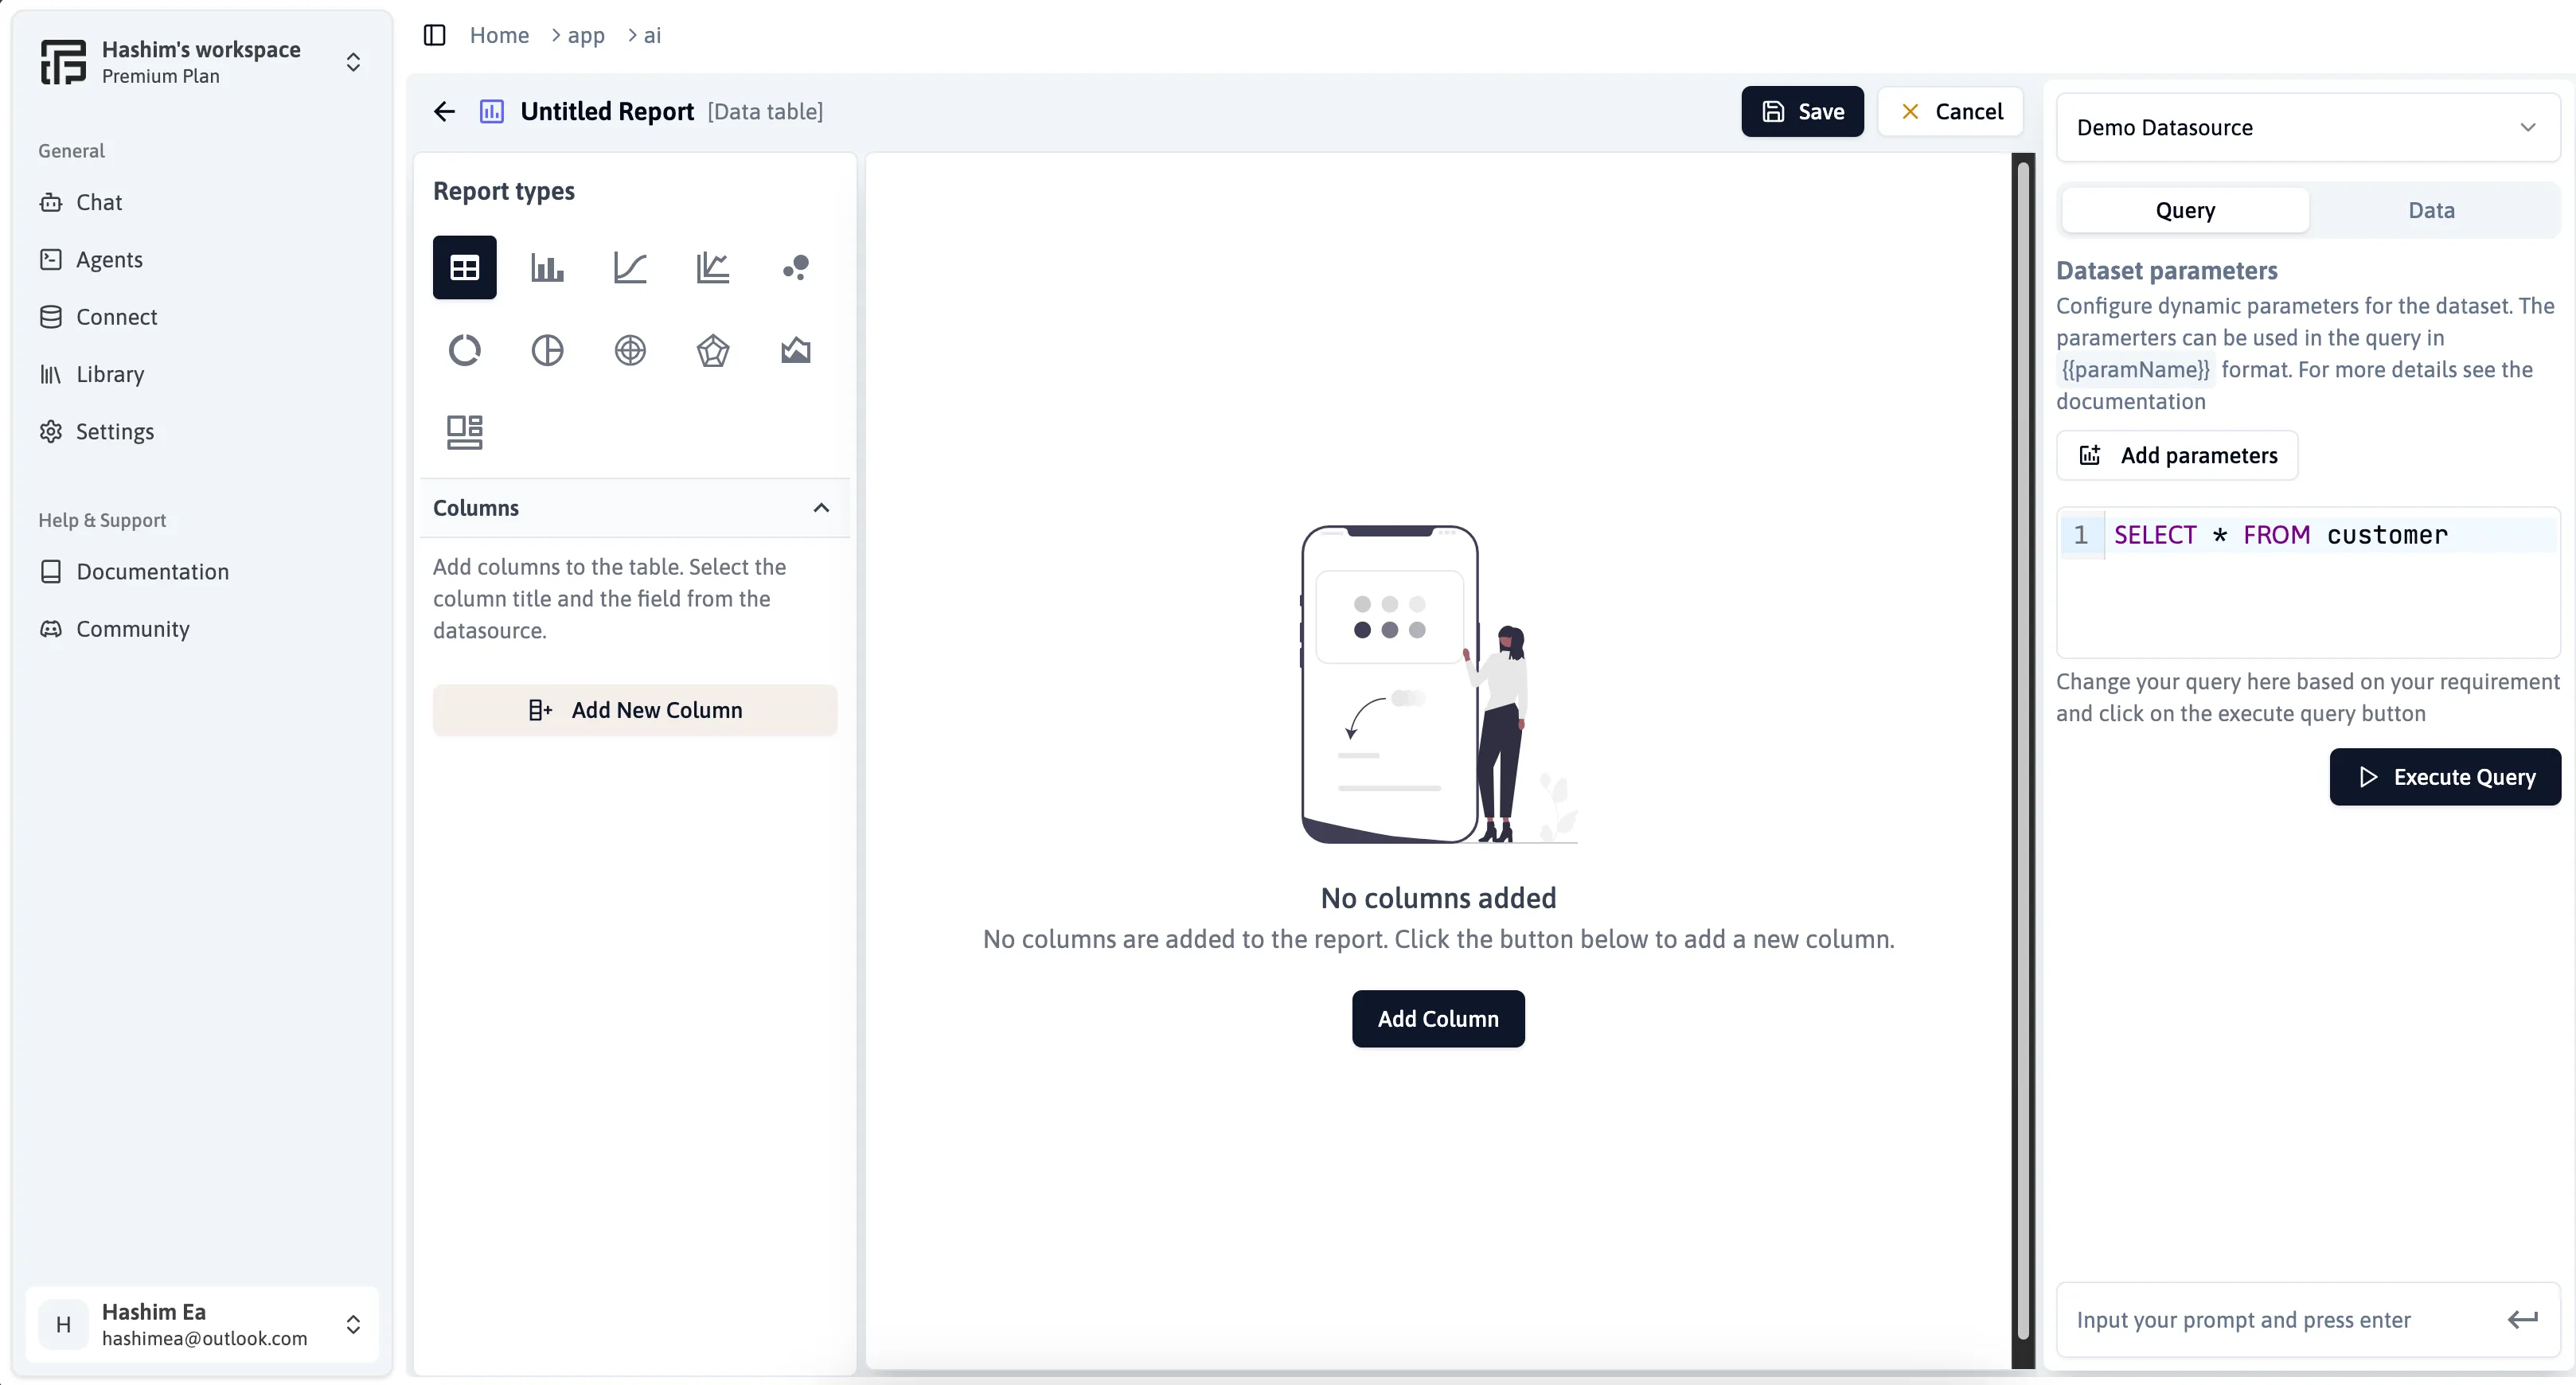
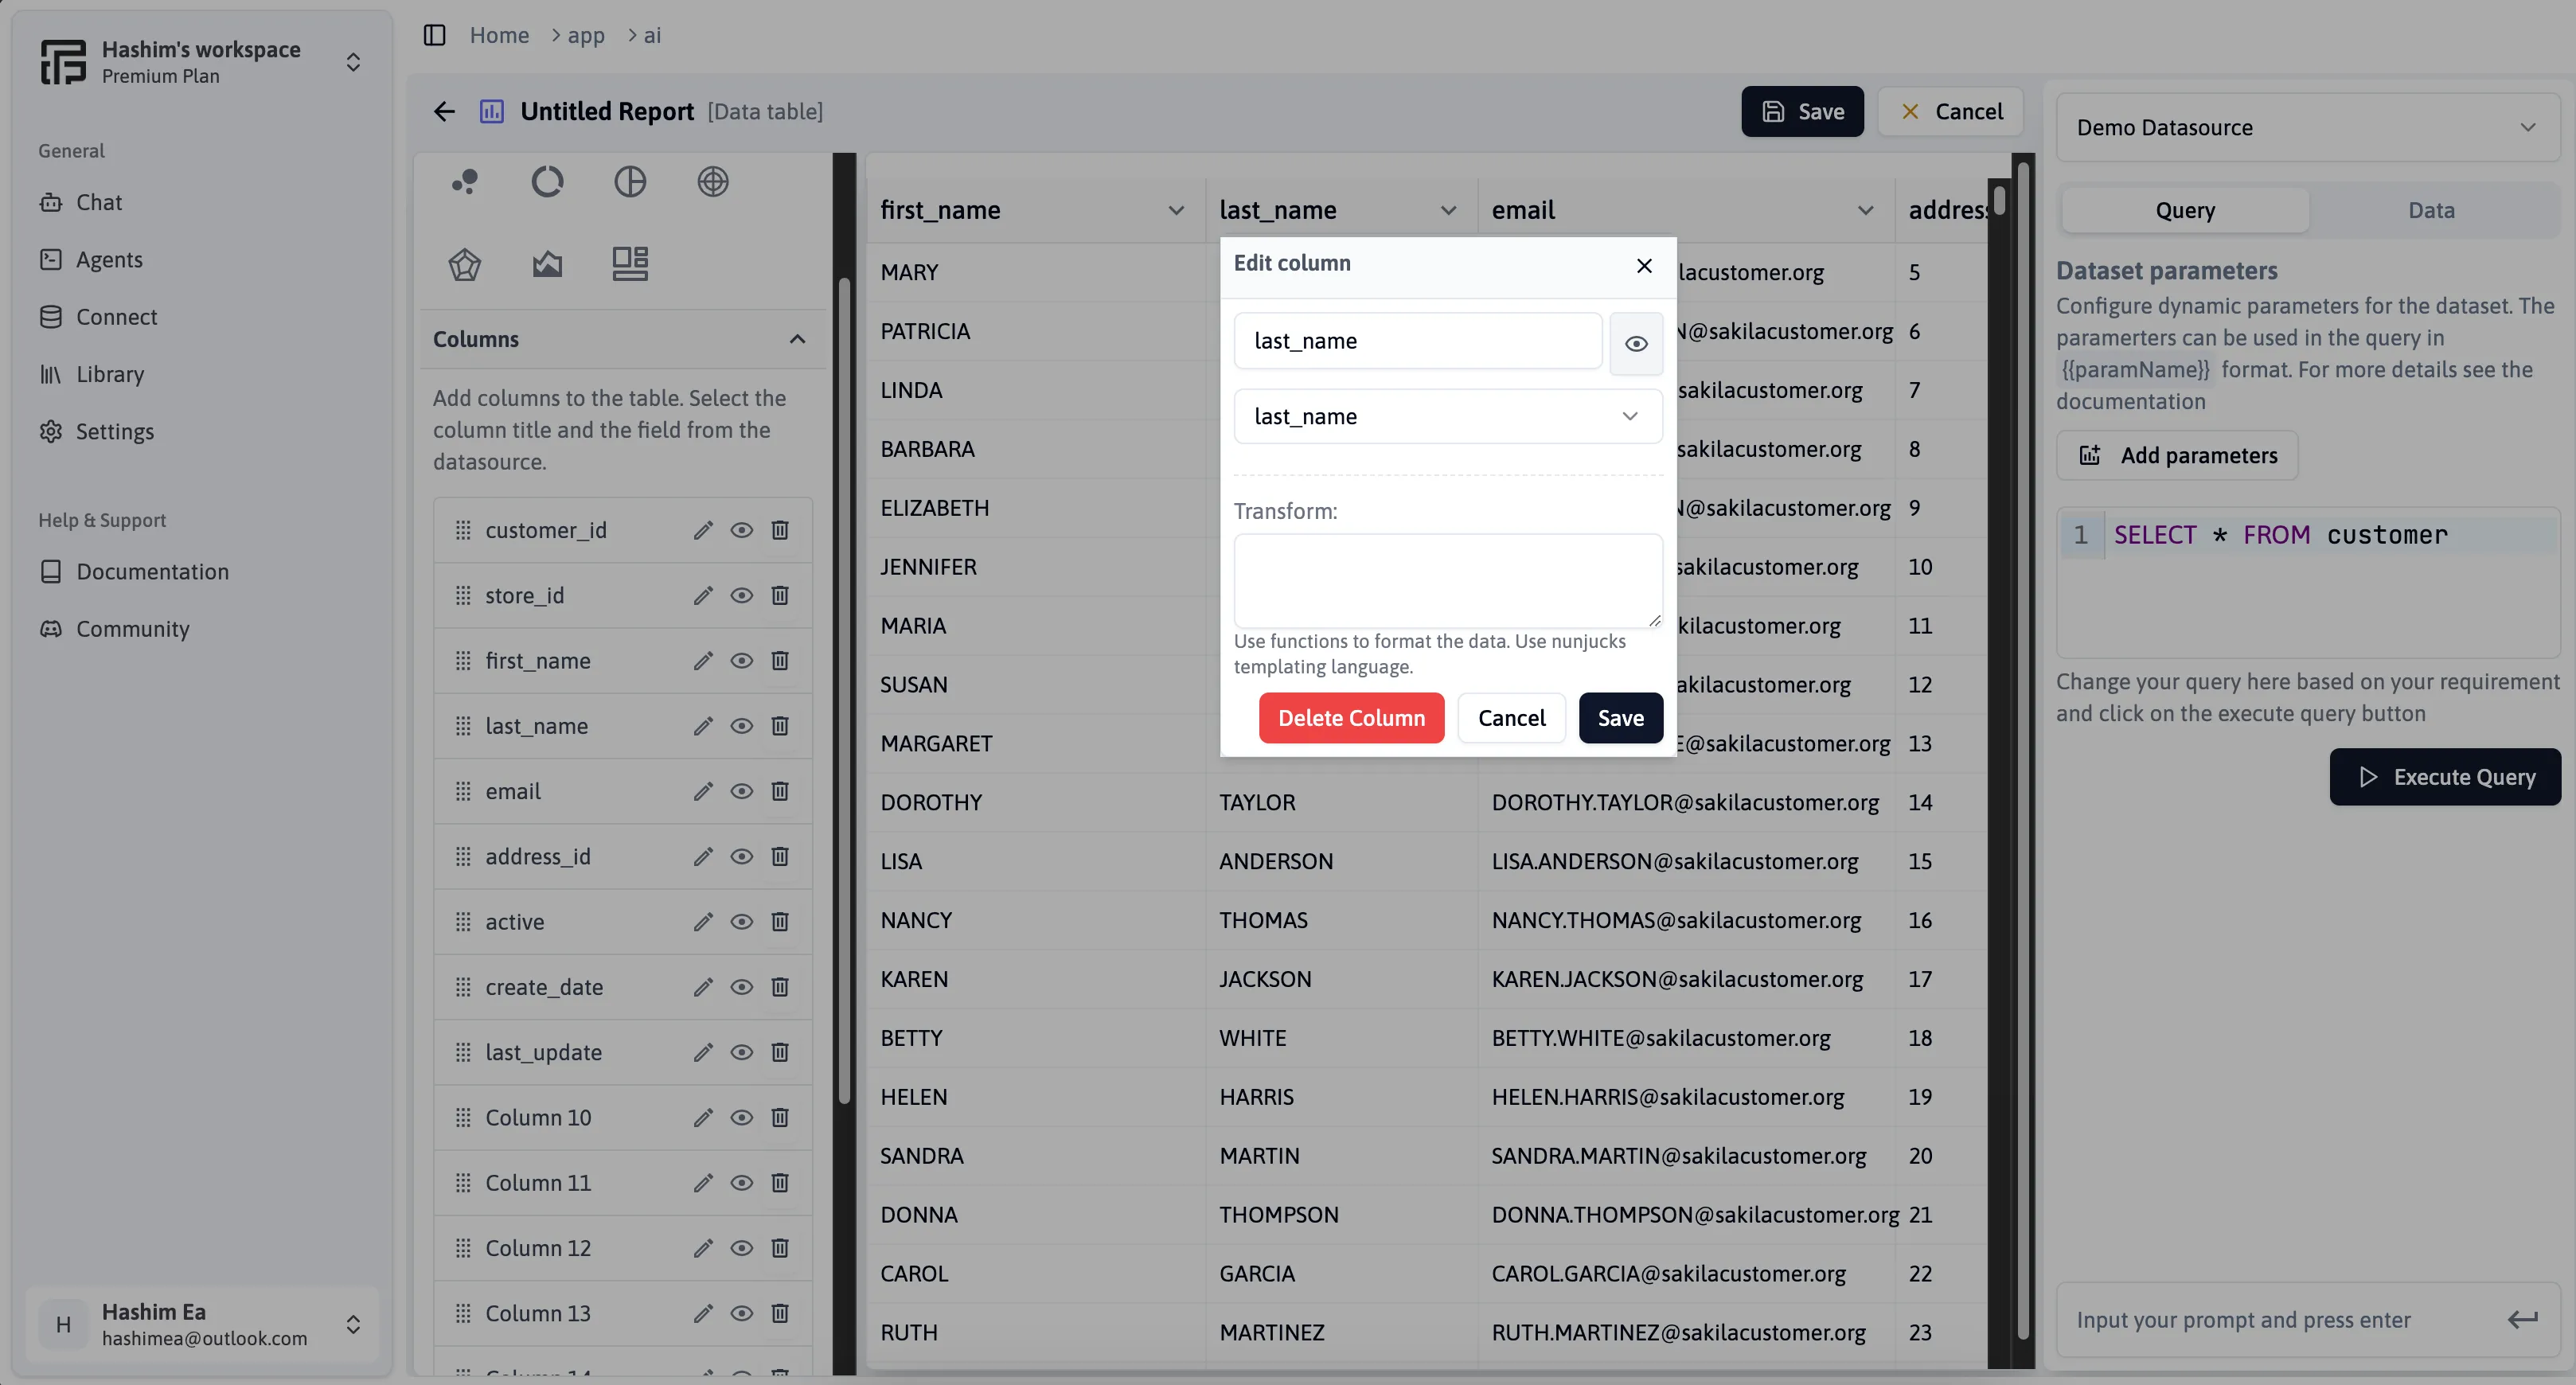
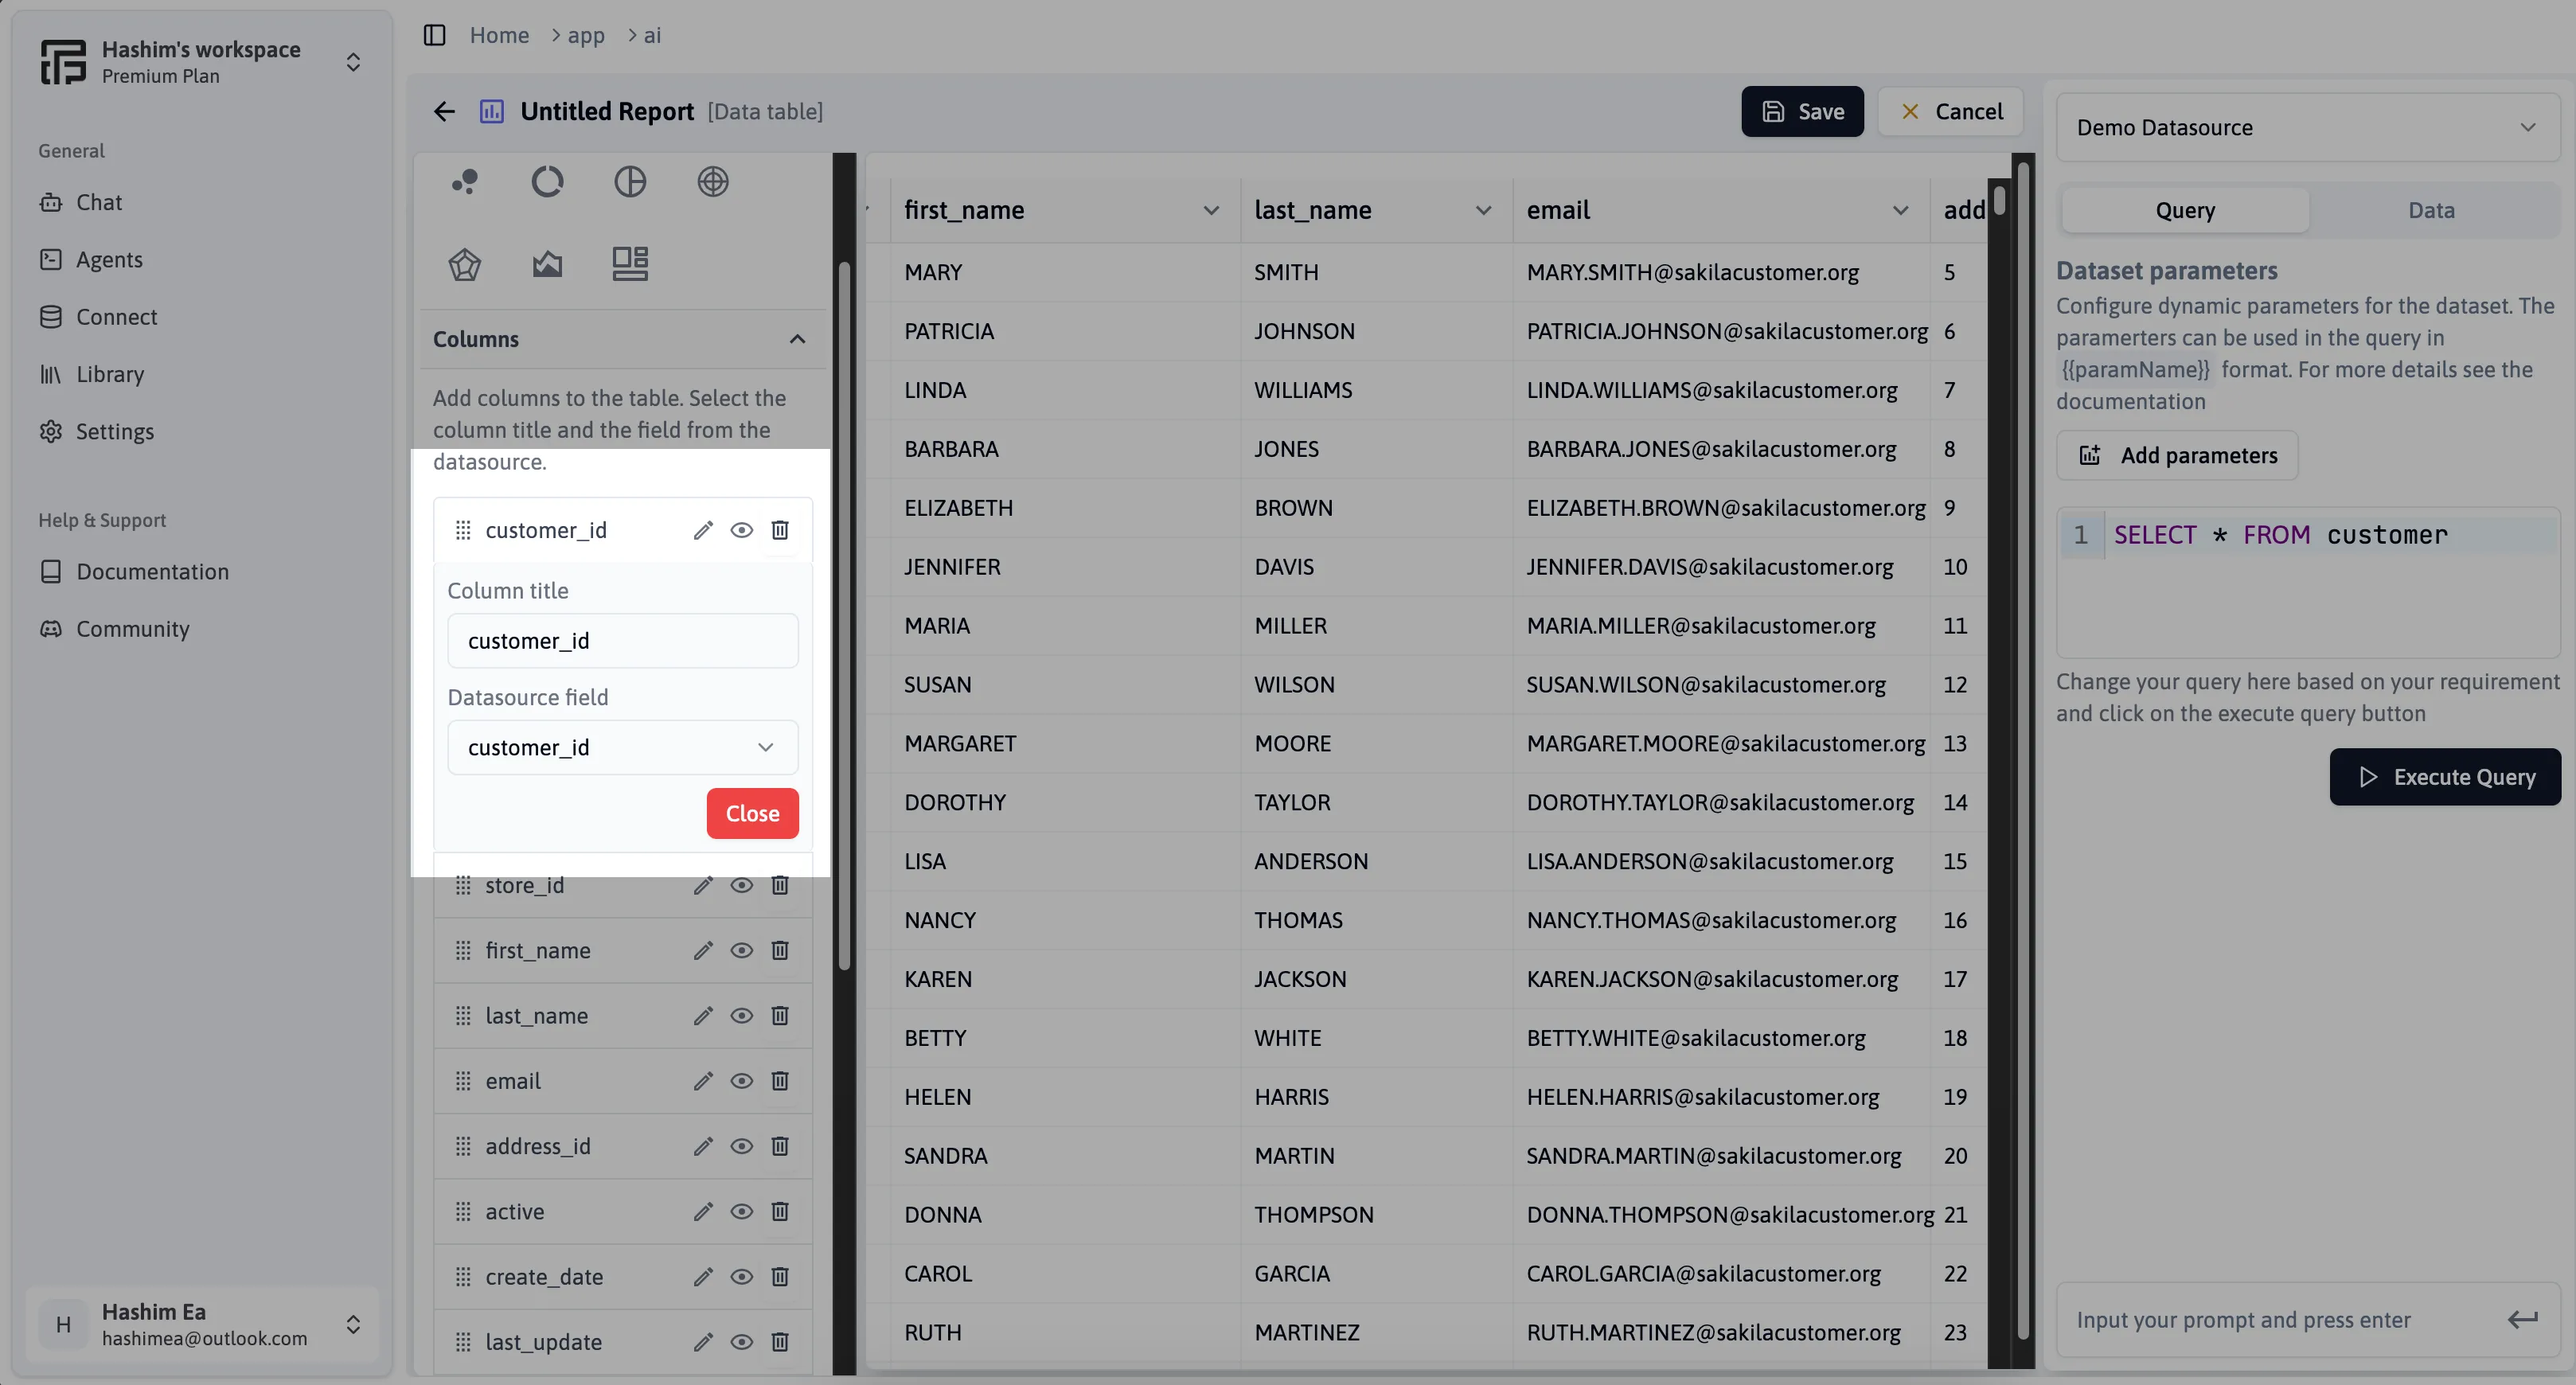
Configure the Columns
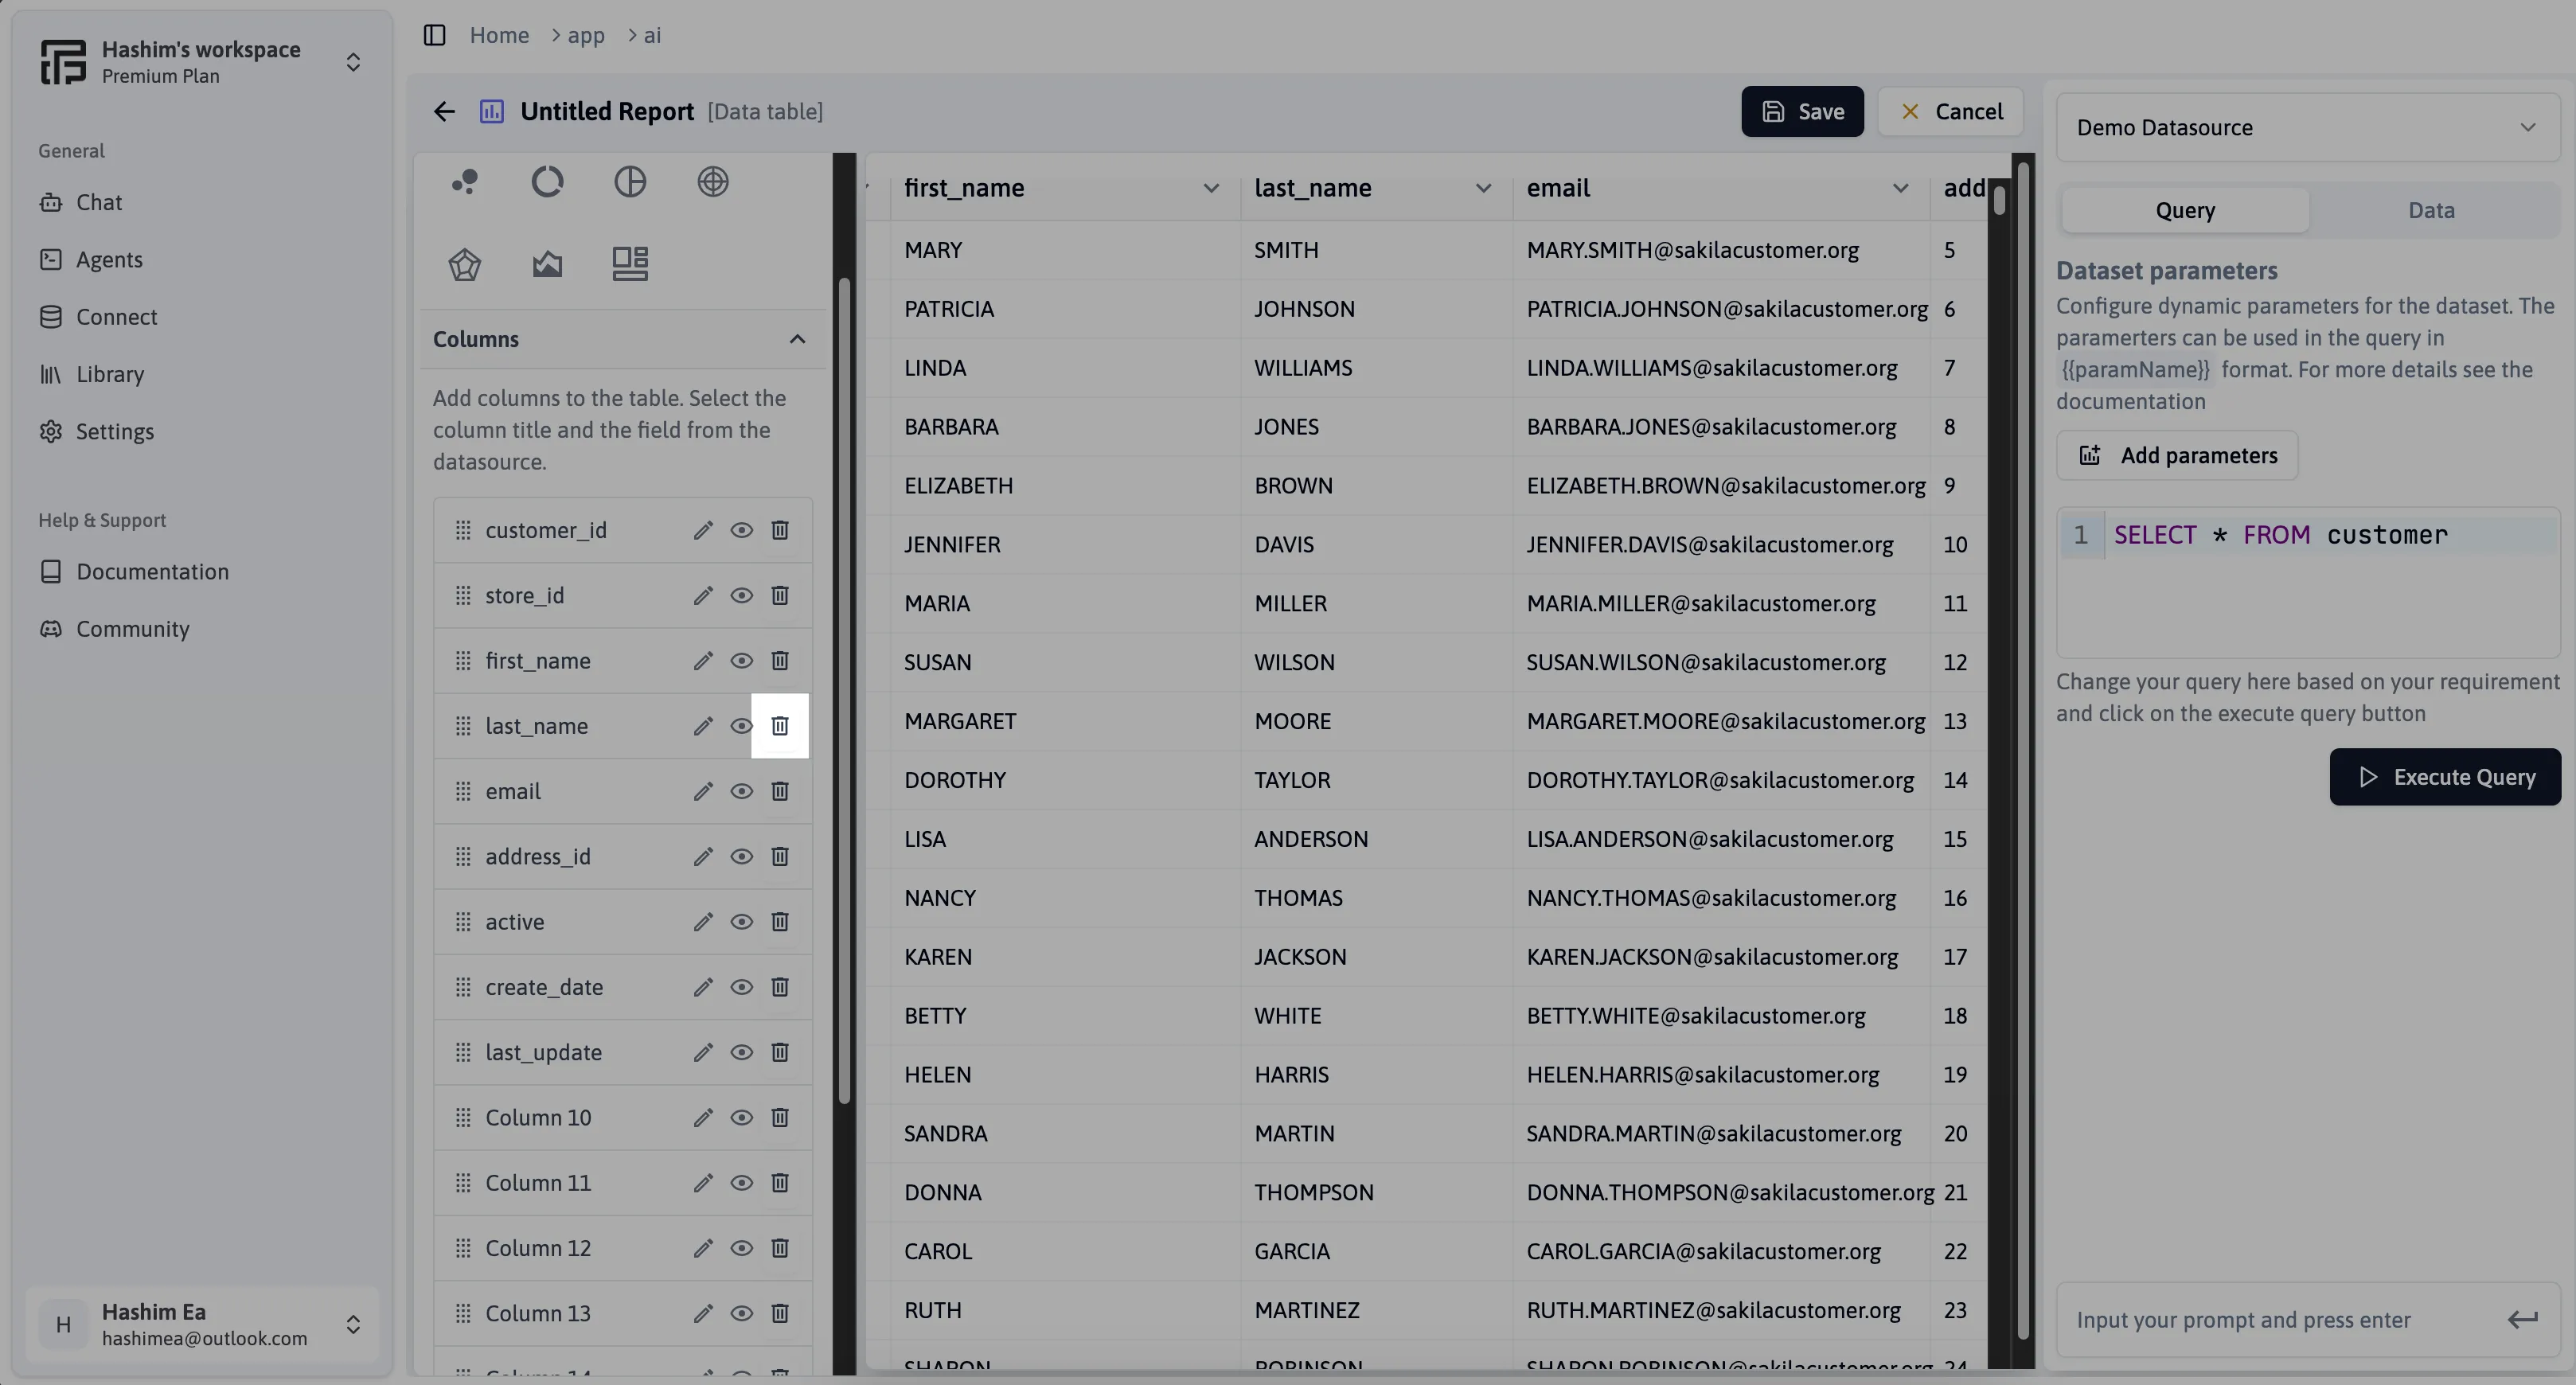
Customize your table report by adding, editing, deleting, or hiding columns. Each column can be set with a title and linked to a specific field from your dataset, allowing for flexible and detailed data presentation.
-
Edit Columns: Modify the properties of existing columns as required.
-
Delete Columns: Remove columns that are not needed.
-
Hide Columns: Temporarily hide specific columns from the report without deleting them.
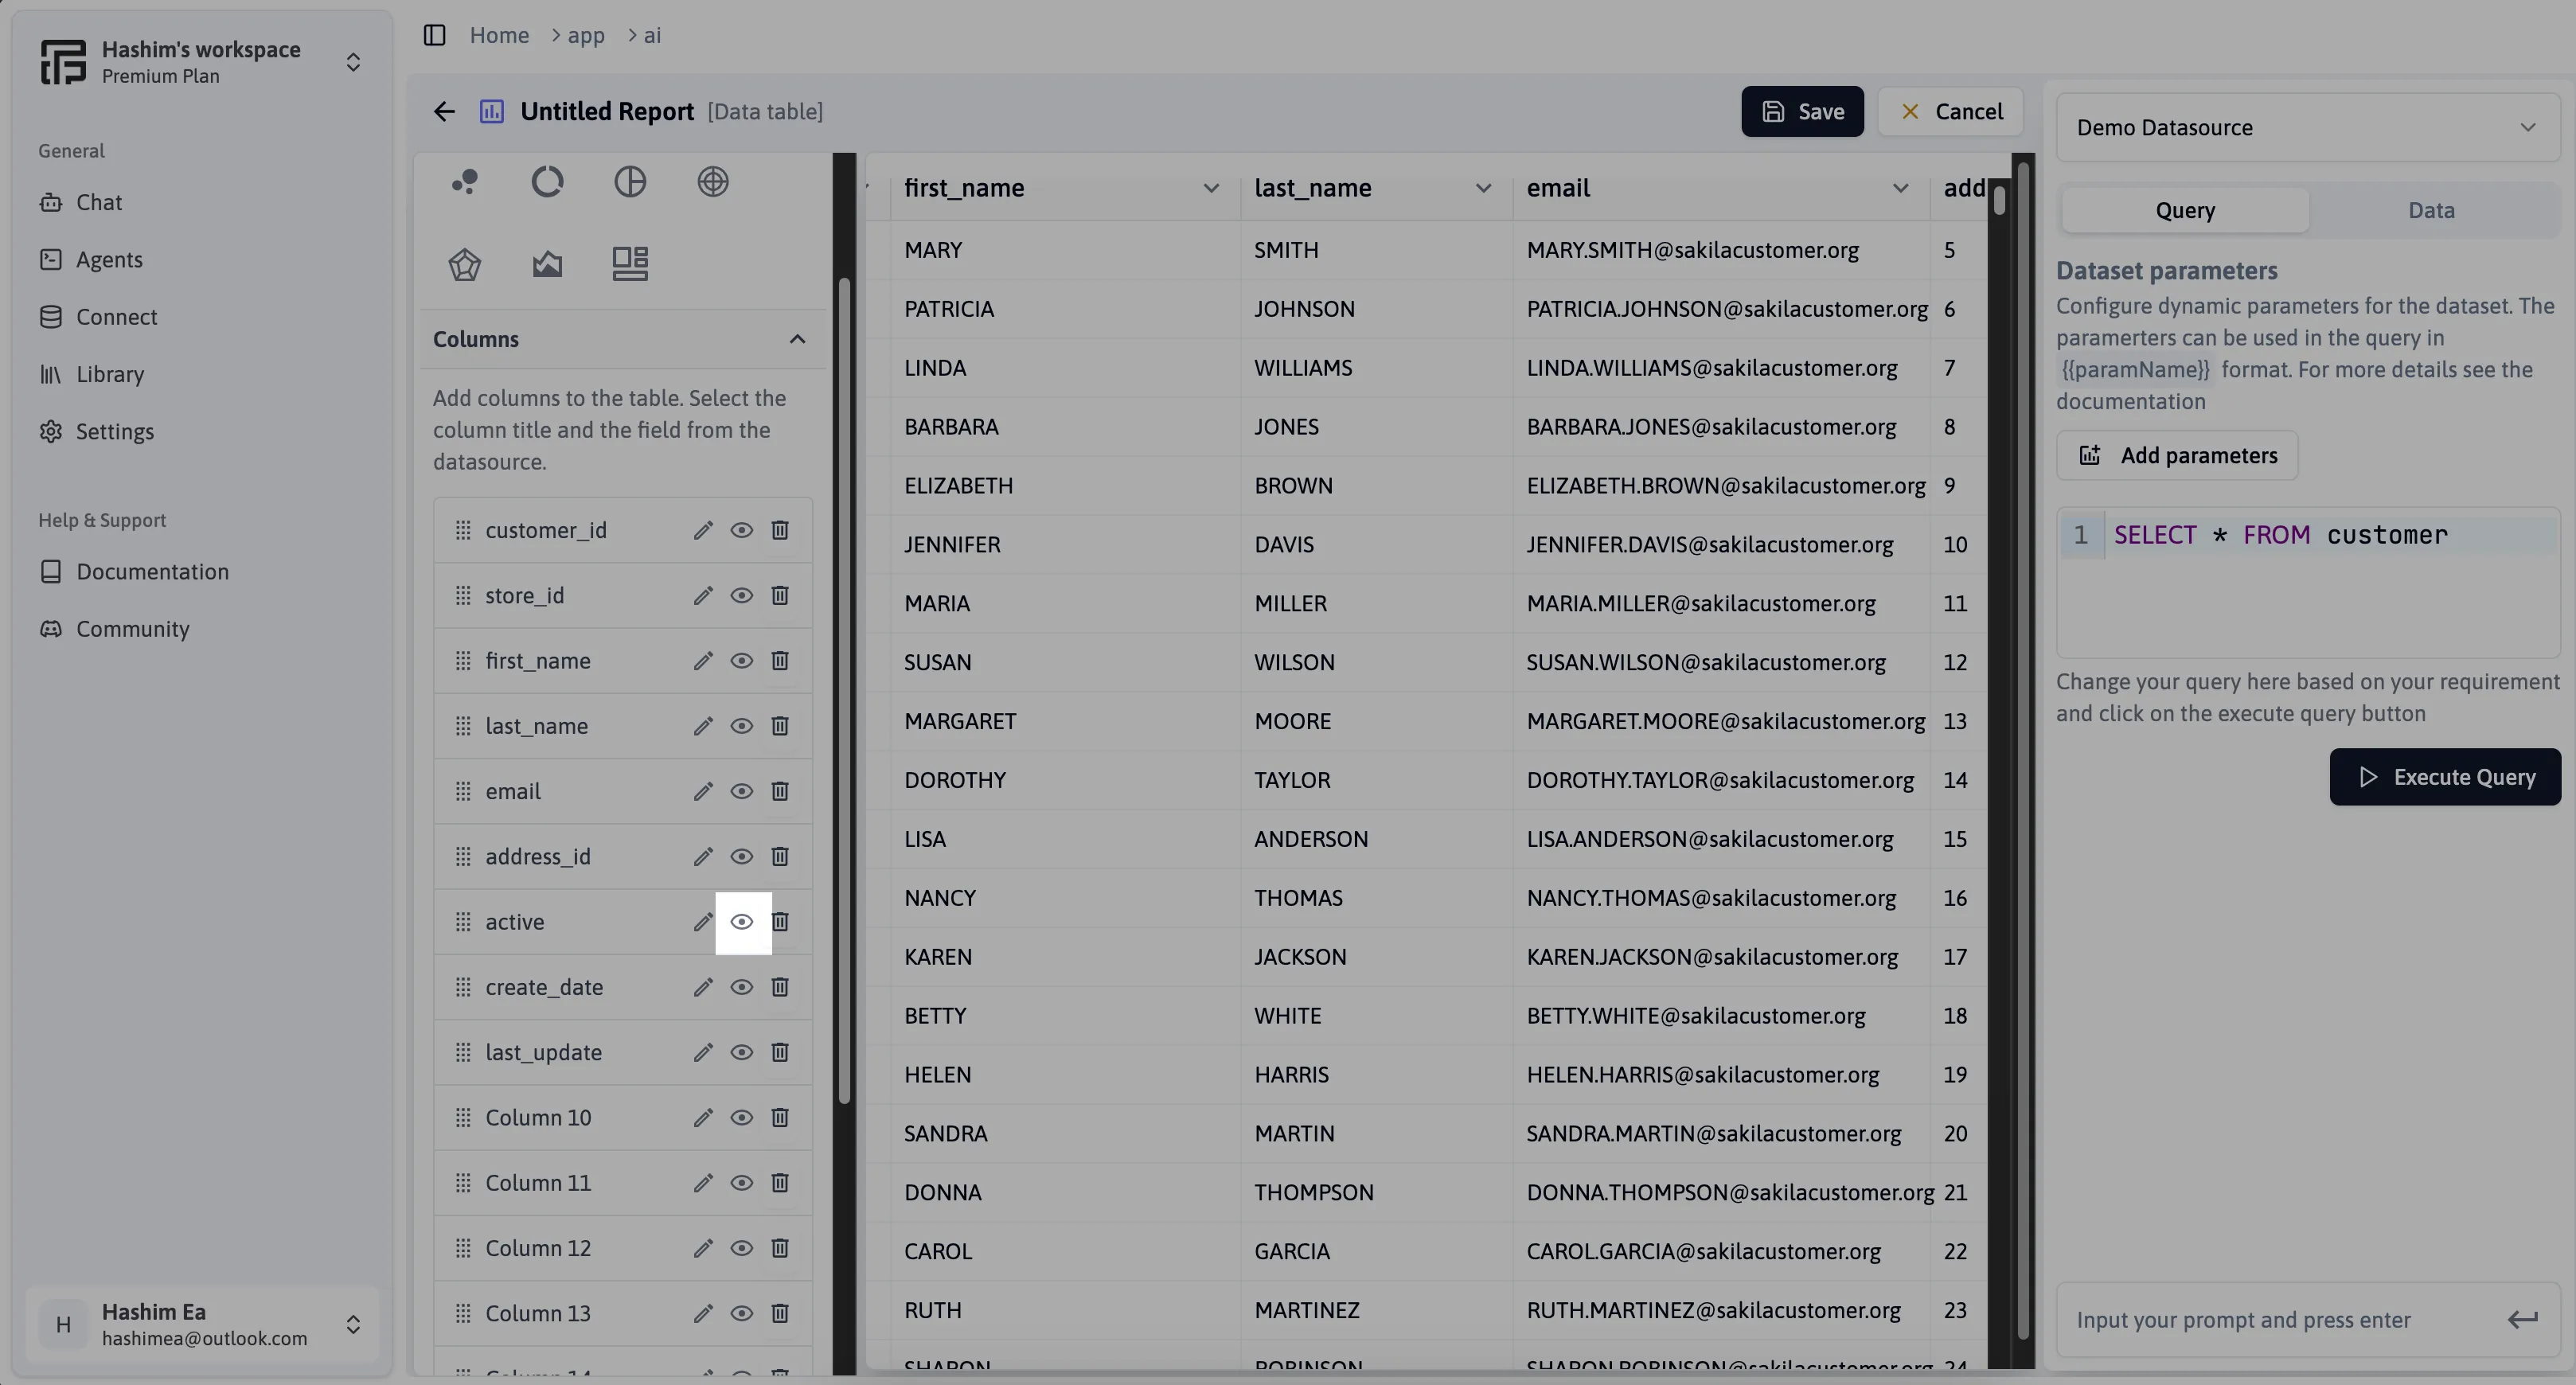
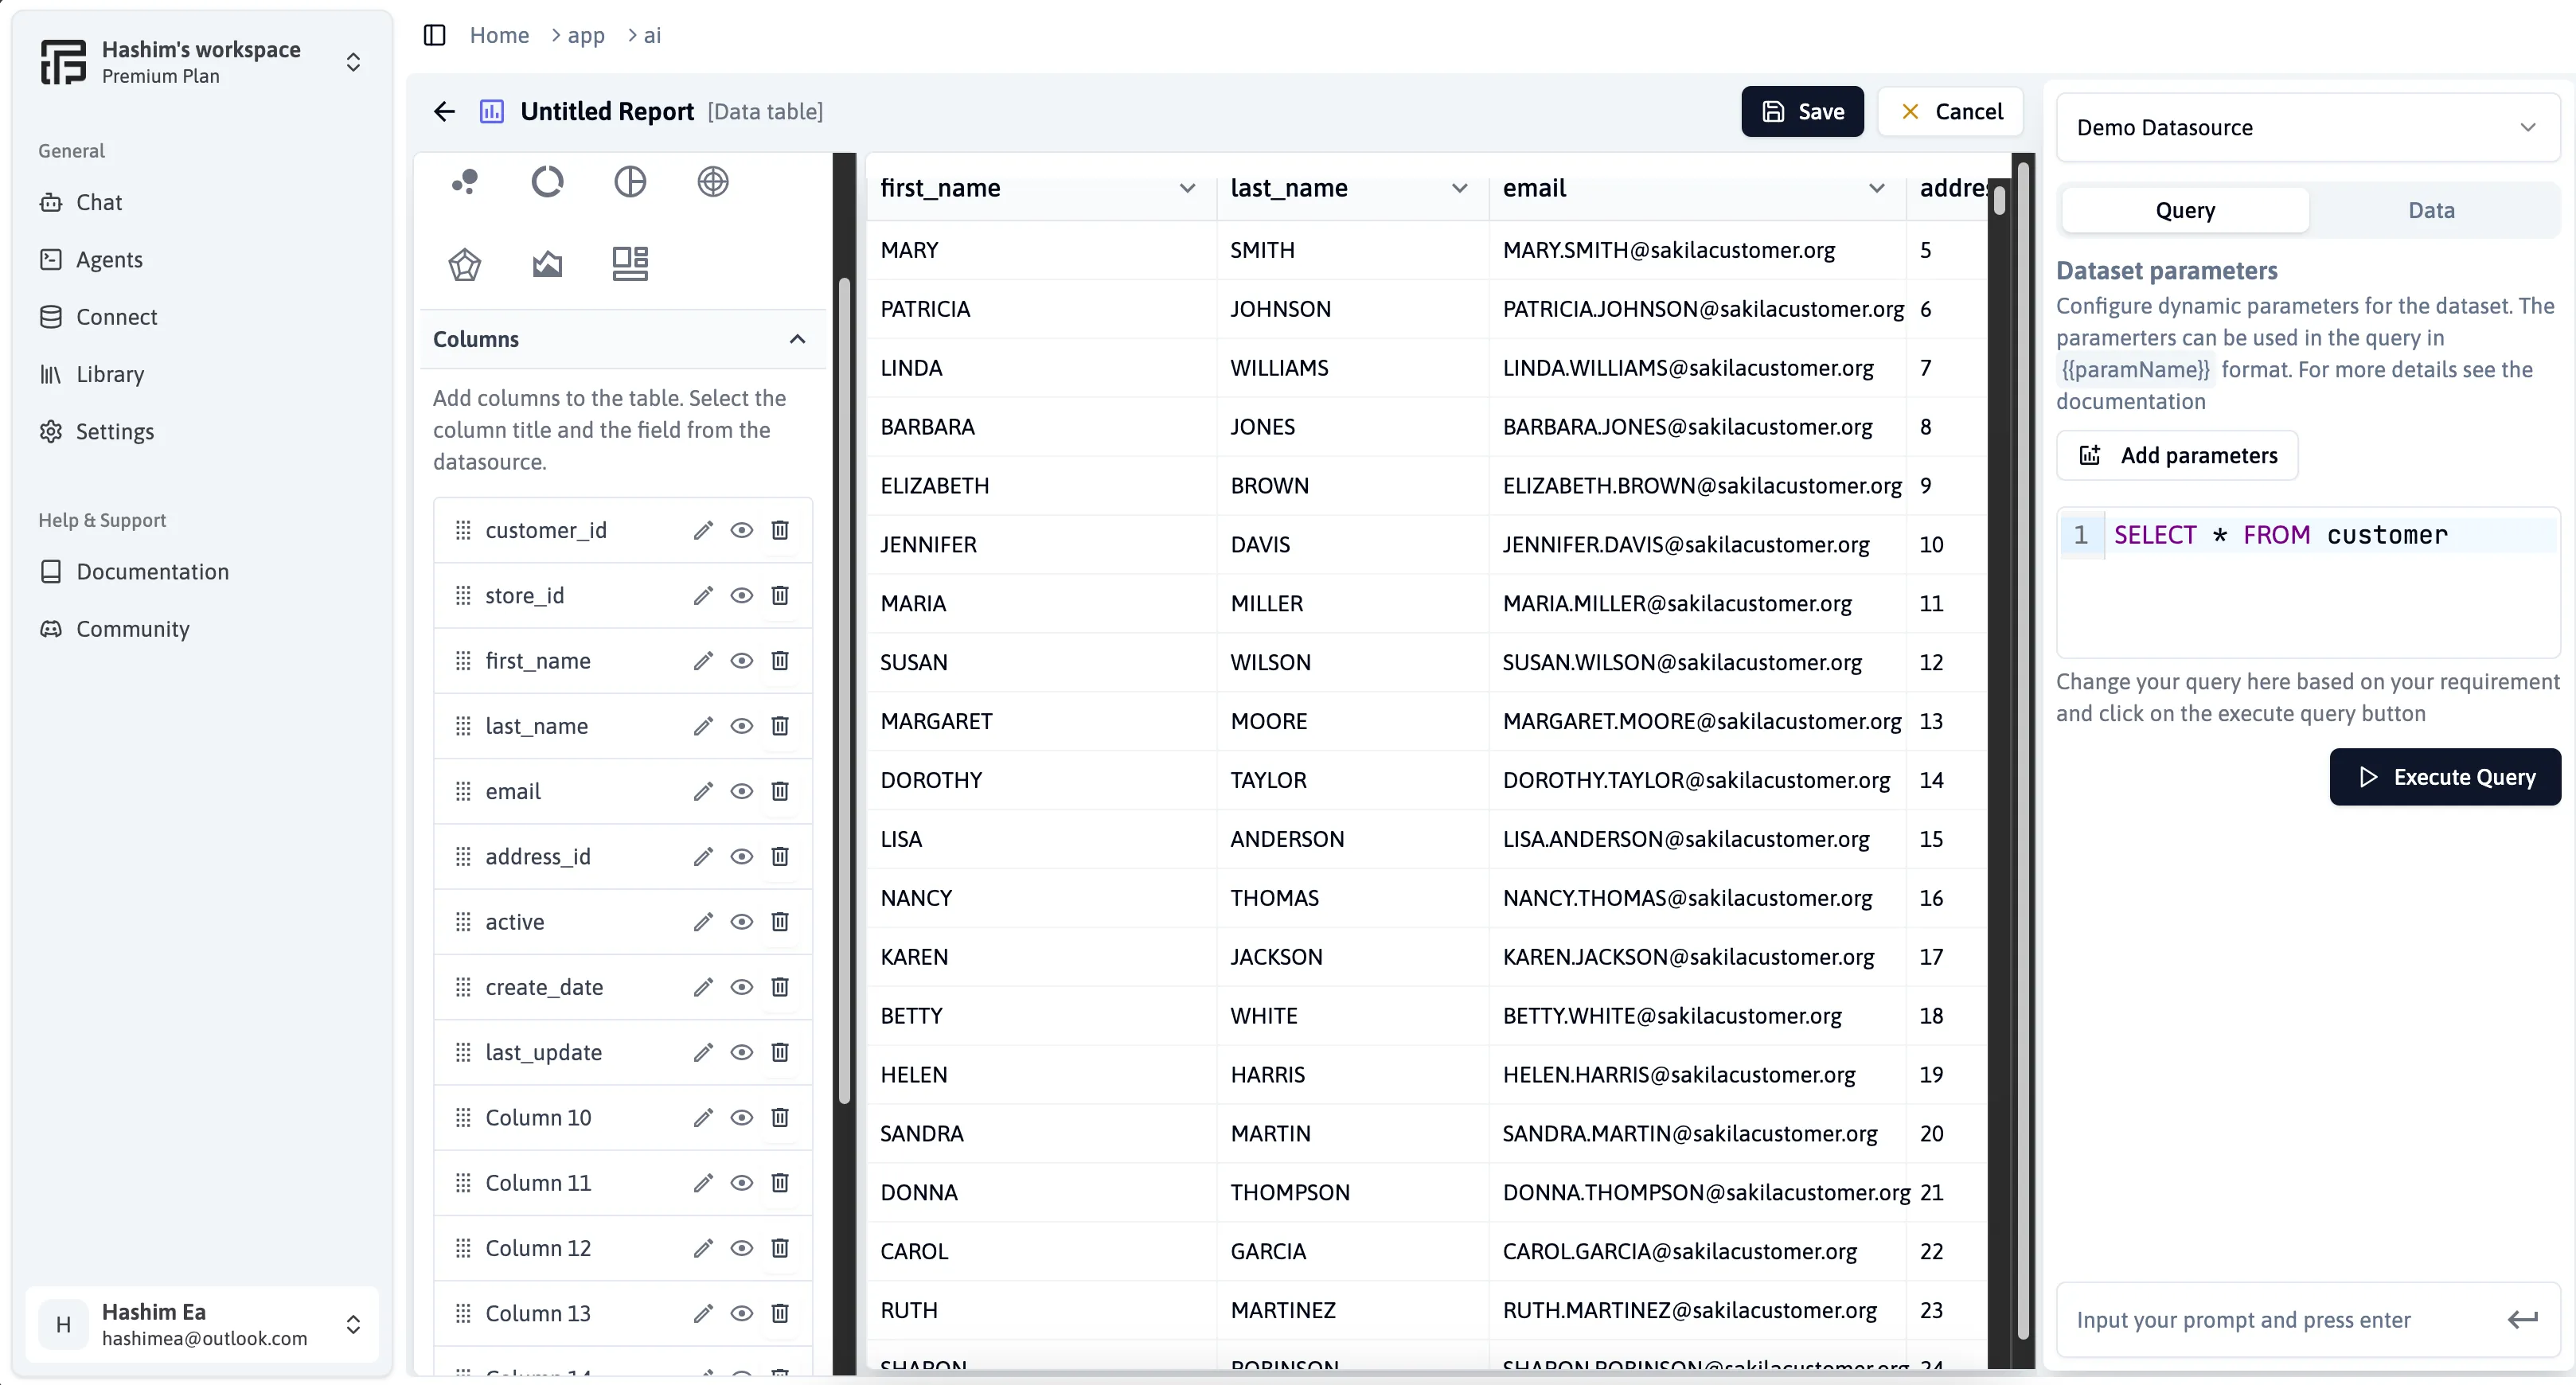
Sample Report Generated
Below is a screenshot of a sample table report generated using Flowtrail AI. This report demonstrates the flexibility and customizability of table reports:
Additional Tips
Enhance your table reports with these additional features
-
Resize Column Width: Adjust the width of the columns by dragging the edges of the column headers.
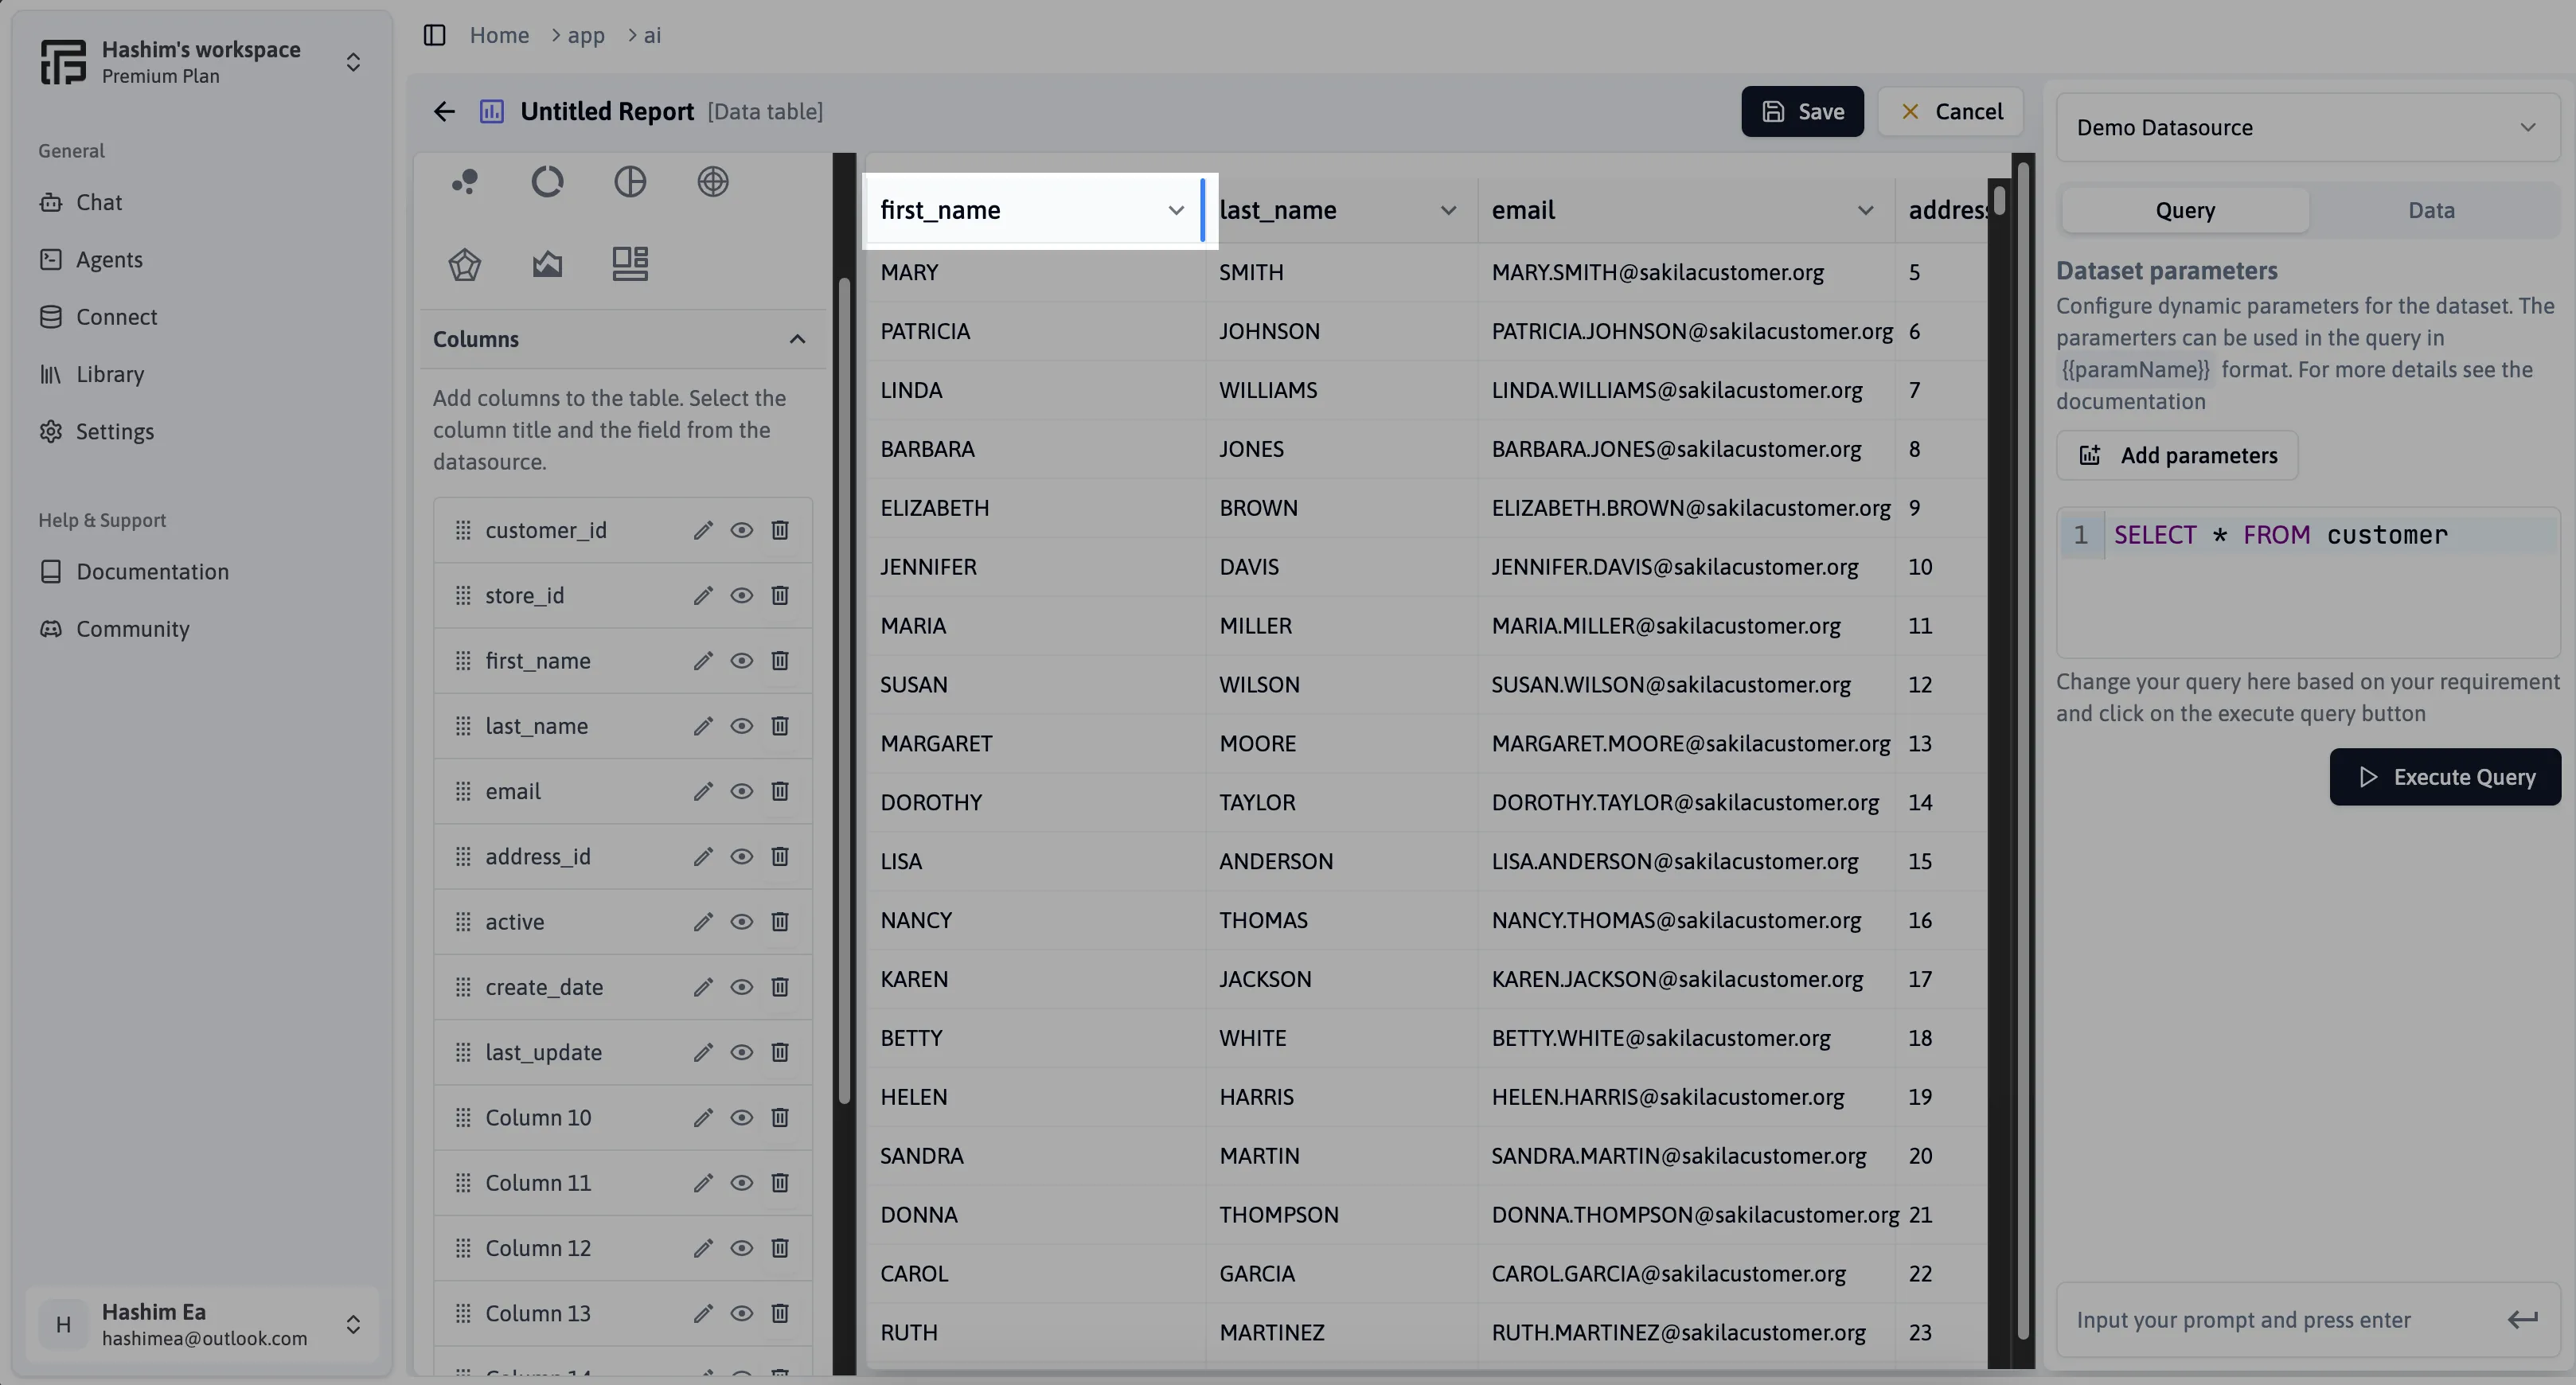
-
Inline Column Property Edit: Quickly edit column properties directly within the table report for a seamless and efficient customization experience.